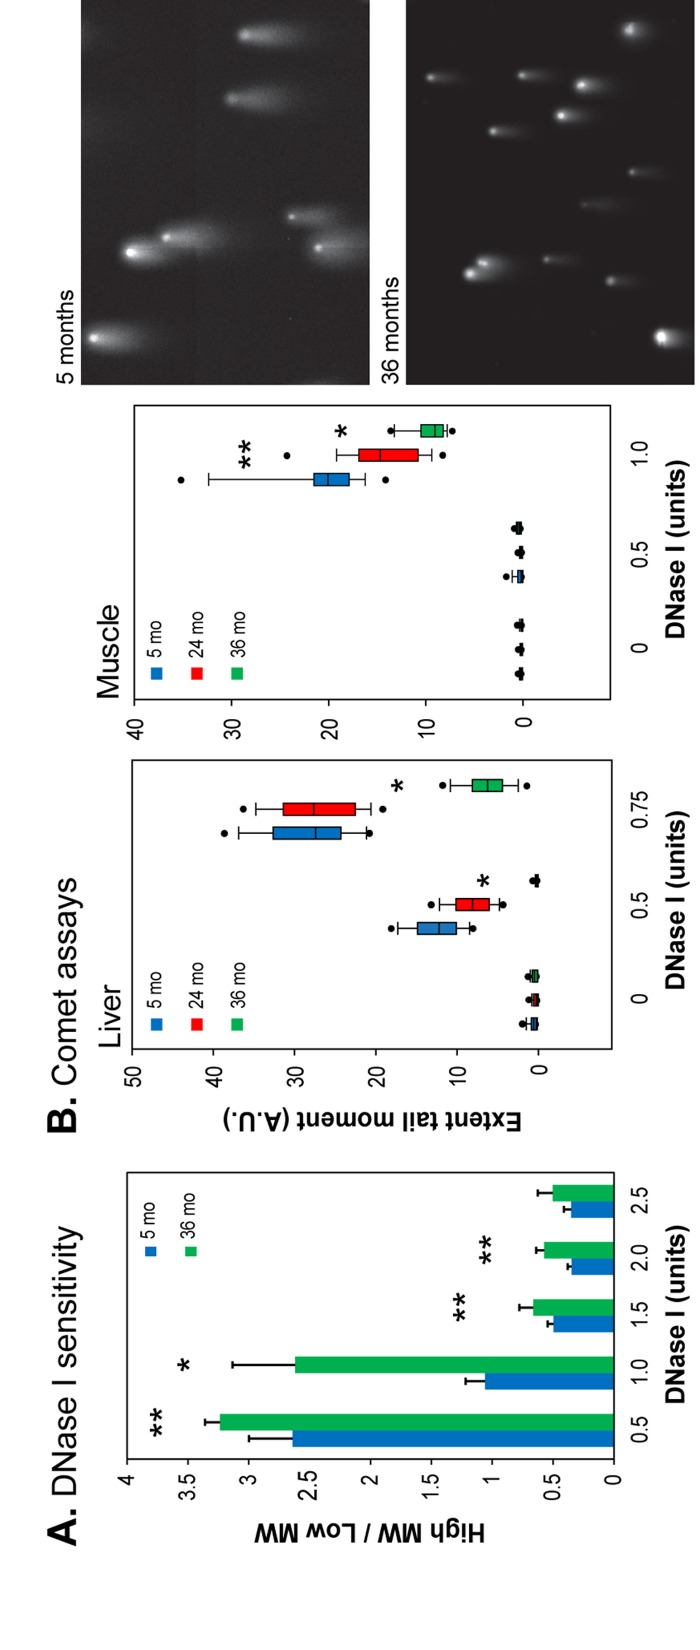
Figure 1. DNase I sensitivity of chromatin in intact nuclei.
(A) The ratio of high to low molecular weight DNA for liver nuclei was calculated following agarose gel electrophoresis (Supplemental Figure 1). Means and standard deviations are shown. (*) p<0.01, (**) p≤0.05, (see Supplemental Information; mo, months). (B) Left panels: the extent tail moment was calculated following single cell electrophoresis (see Supplemental Figure 2 for alternative quantification). Data are shown as box plots (box shows median 50% (25%-75%), whiskers the 90%-10% range, dots the 95% and 5% values (A.U., arbitrary units). Right panels: representative images of Comet assays (liver, 0.5 units DNase I, 10 min).

