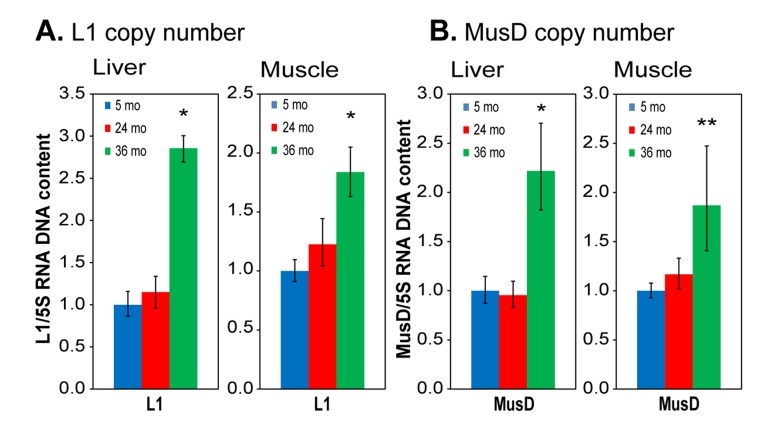
Figure 6. qPCR analysis of DNA to assess RTE genome copy number.
(A) L1; (B) MusD. Total DNA was extracted from tissues of the same animals and tissues as used in Figure 4. Relative copy numbers were quantified using a multiplex TaqMan qPCR assay with the indicated primers (Table S1) and normalized to 5S ribosomal DNA. Data were additionally normalized to the 5 month value for each element (shown as 1.0). 5S DNA copy number was independently verified not to vary with age or between animals or tissues using qPCR against known single copy sequences. Means and standard deviations are shown. (*) p<0.01; (**) p≤0.05.

