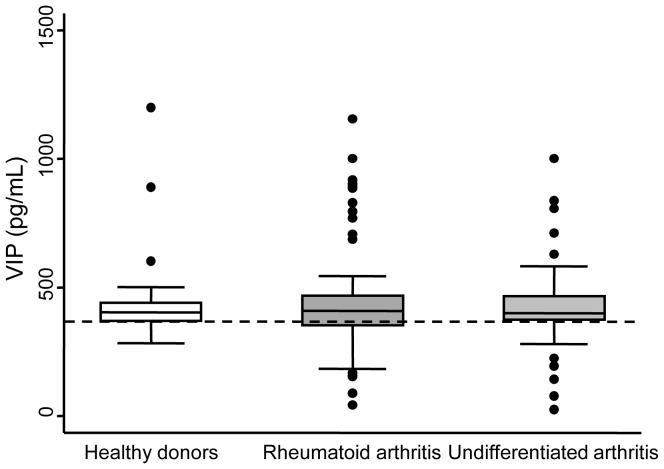
Figure 1. Variability of VIP levels in healthy controls (n = 100) and patients with early arthritis (Rheumatoid arthritis n = 69, Undifferentiated arthritis n = 22).
Data are presented as the interquartile range (p75 upper edge of the box, p25 lower edge, p50 midline), p90 (line above the box), and p10 (line below the box) of the serum VIP levels. Dots represent outliers. Dashed lines show the 25th percentile of the healthy donor group.

