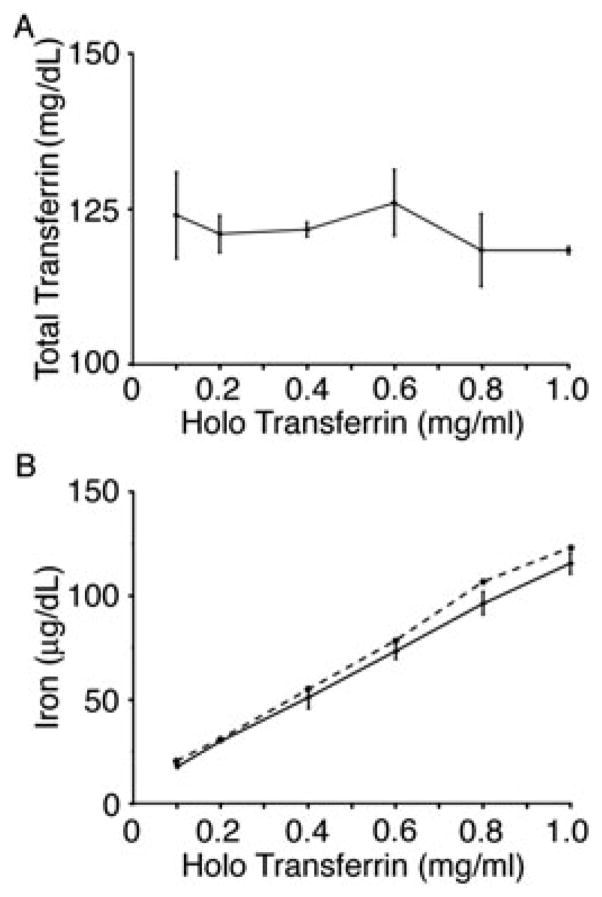
Figure 1.
Analysis of iron and transferrin. (A) Representative graph of the total amount of transferrin present in culture day 21 conditioned media at the following concentrations: 0.1, 0.2, 0.4, 0.6, 0.8 and 1.0 mg/ml holo-Tf. (B) Representative graph of the amount of iron utilized during the 14 day EPO culture conditioned media (solid line) coinciding with the amount of iron present in the freshly-prepared media (dashed line). Bars represent the standard deviation of the mean values from three separate donors

