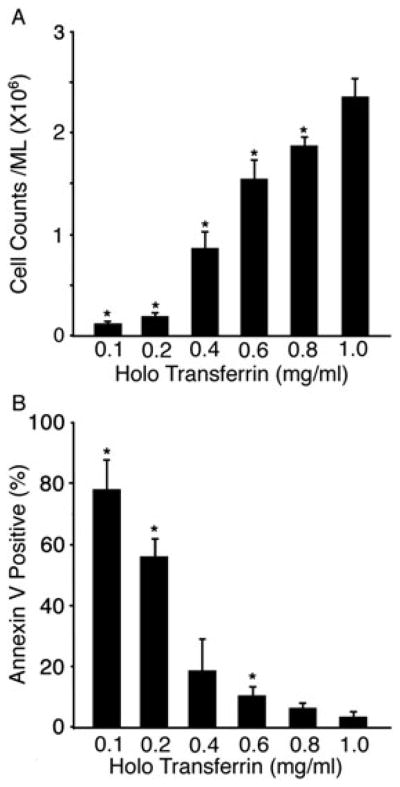
Figure 2.

Iron effects upon cell growth and survival. (A) The proliferation of CD34+ cells over a 14 day EPO culture conditioned media period with transferrin titrations at 0.1, 0.2, 0.4, 0.6, 0.8 and 1.0 mg/ml. (B) The level of phosphatidylserine on the surface of the live cell population at culture day 21. Bars represent the standard deviation of the mean values from three separate donors with asterisks signifying p ≤ 0.05 when compared to the 1.0 mg/ml dose
