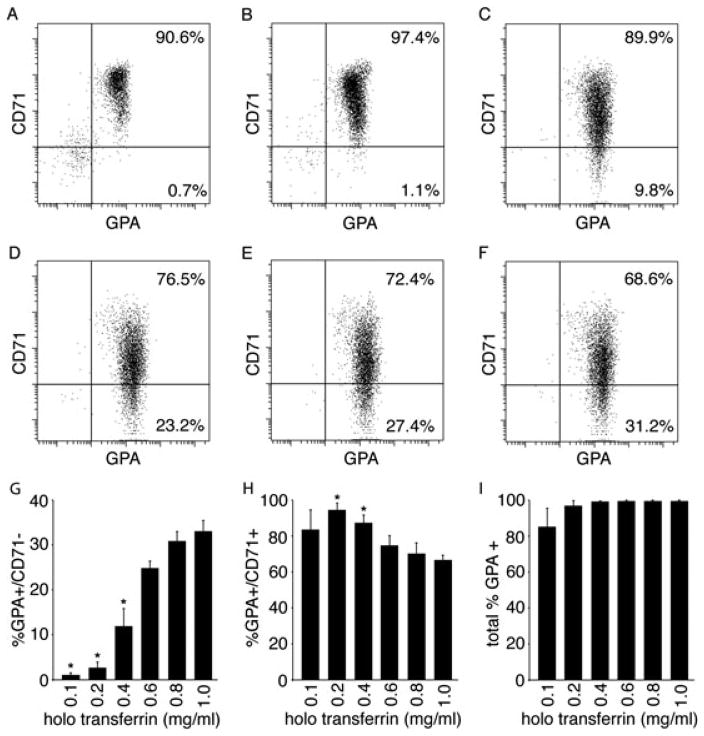
Figure 3.
The effects of a dosed iron titration on cell maturation. Representative flow cytometric dot plots of the differentiation of CD34+ cells cultured in dosed iron titration media at (A) 0.1, (B) 0.2, (C) 0.4, (D) 0.6, (E) 0.8, and (F) 1.0 mg/ml holo-Tf for transferrin receptor (CD71) and glycophorin A (GPA) at culture day 21. Using cells from three separate donors, average percent values for GPA +/CD71−, GPA+/CD71+, total GPA + are shown in panels G, H, I respectively. Bars represent the standard deviation of the mean values from three separate donors with asterisks signifying p ≤0.05 when compared to the 1.0 mg/ml dose

