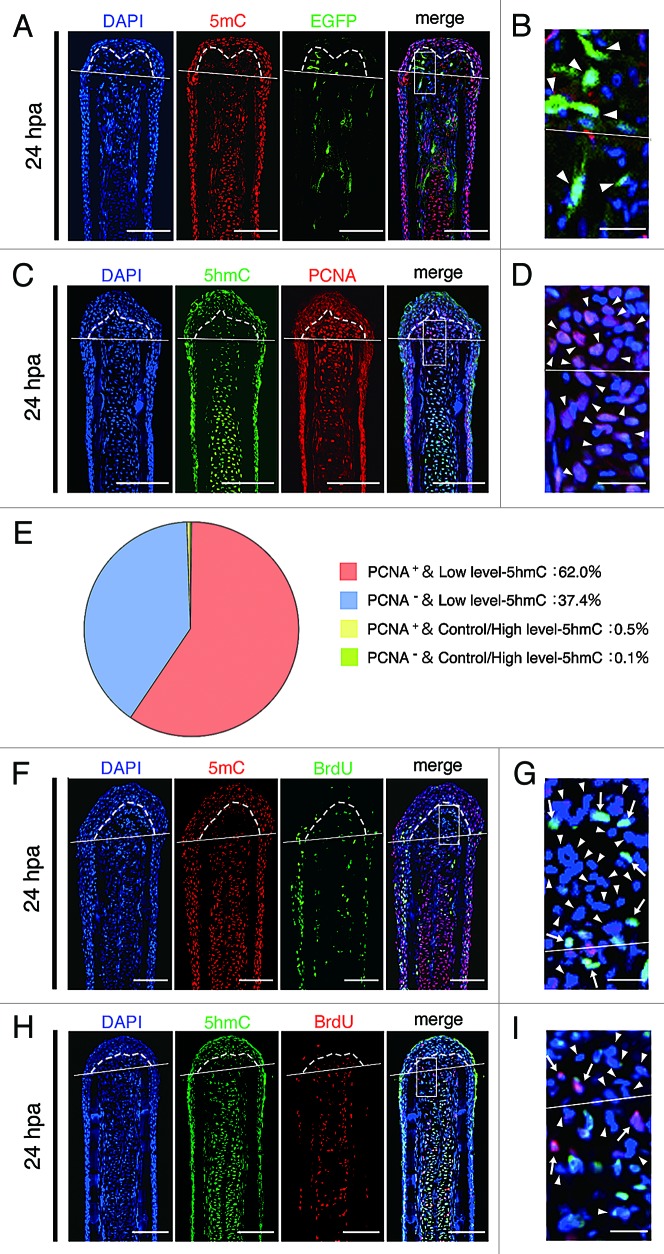
Figure 2. Downregulation of 5mC or 5hmC level is associated with active demethylation. (A and B): Longitudinal sections of Tg(ef1-α:EGFP) fin regenerates that immunohistochemimally stained with an antibody against 5mC at 24 hpa. Merged images revealed that some cells, which show low level of 5mC, are EGFP fluorescence positive in the blastema cells and cells adjacent to amputation plane (A, arrowheads in B). The boxed area in A is shown enlarged in B. (C–E) Longitudinal sections of wild type fin regenerates that were co-stained with antibodies against 5hmC and PCNA at 24 hpa (C). The boxed area in C is shown enlarged in D. Quantification of the relative 5hmC intensity and PCNA in the blastema area at 24 hpa (E). Merged images and quantification data revealed that the majority of the blastema nuclei (62.0%) show PCNA-positive and low level-5hmC (E, C, arrowheads in D). Control/High level-5hmC: control or high level of 5hmC, Low level-5hmC: low level of 5hmC. (F–I) Longitudinal sections of wild type fin regenerates that were co-stained with antibodies against 5mC/5hmC and BrdU at 24 hpa, respectively. BrdU is not incorporated in almost all blastema cells and cells adjacent to amputation plane that show lower level of 5mC or 5hmC (FandH, arrowheads in GandI). However, BrdU is incorporated in some blastema cells and cells adjacent to the amputation plane, which show lower level of 5mC or 5hmC (arrows in G and I). The boxed areas in F and H are shown enlarged in G and I, respectively. White lines indicate the amputation planes. Dashed lines outline the basement membrane, which shows the boundary between the epidermis and blastema. Scale bars:100 μm in A, C, F, and H; 20 μm in B, D, G, and I.

An official website of the United States government
Here's how you know
Official websites use .gov
A
.gov website belongs to an official
government organization in the United States.
Secure .gov websites use HTTPS
A lock (
) or https:// means you've safely
connected to the .gov website. Share sensitive
information only on official, secure websites.
