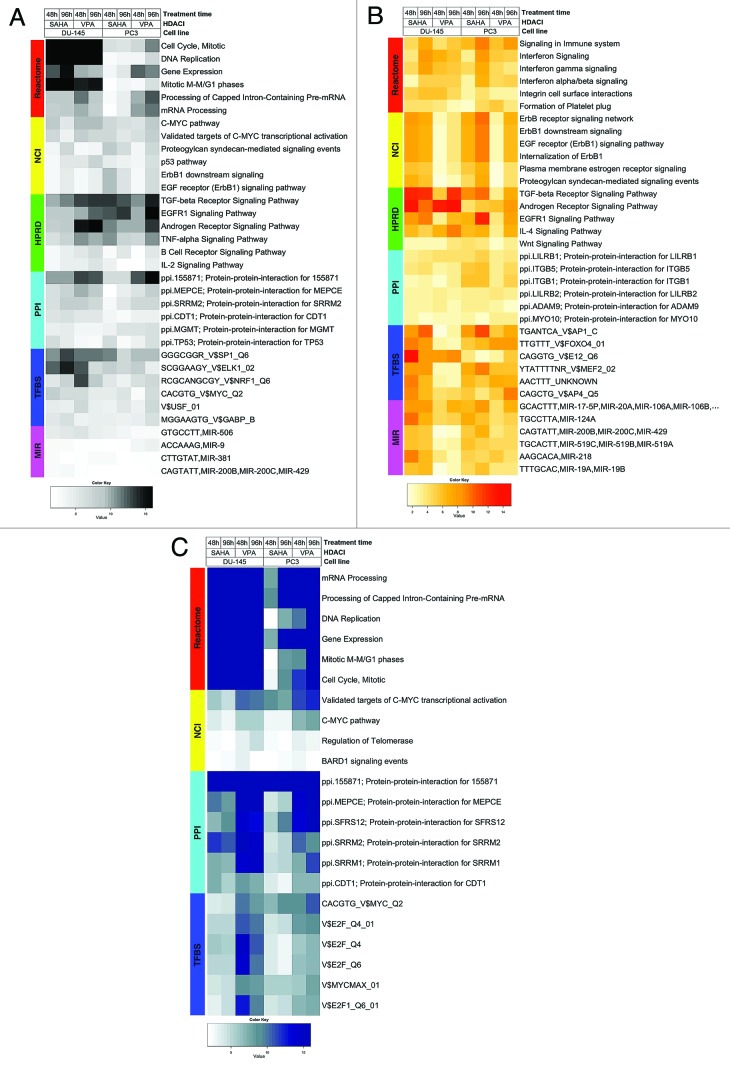
Figure 1. Heat maps visualizing differentially expressed functional gene sets (FGS) as determined by analysis of functional annotation (AFA) performed on DU-145 and PC3 cells treated with HDAC-inhibitors (HDACis) VPA or vorinostat for 48 or 96 h. Each row represents a distinct FGS, while each column represents a distinct coefficient from our previous linear model analysis. The FGS that were most significantly differentially expressed across all comparisons performed are shown in the figure (top 5 FGS showing an adjusted p-value ≤ 5%, or more in case of ties). Color scales correspond to the absolute adjusted p-values obtained from our analysis after base 10 logarithmic transformations (i.e., the number on the color scale increases with decreasing adjusted p-values). Differentially expressed FGS were selected from different collections in order to encompass distinct biological concepts, as shown by the color bar on the left of each heat map. Cell signaling FGS are highlighted in red and yellow (Pathway Commons Reactome and NCI pathways, respectively), signaling pathway target gene sets in green (Human Protein Reference Database, HPRD), protein-protein-interaction networks in cyan (PPI, as compiled in the NCBI Entrez Gene database), FGS for shared transcriptional factor binding sites (TFBS) in blue, and microRNA (MIR) targets gene sets in pink (both from the Broad Institute Molecular Signature Database collections). For complete tables and heat maps visualizing all differentially expressed FGS, see supplementary data (available at the journal’s website and at http://luigimarchionni.org/HDACIs.html). (A) Differentially expressed FGS after ordering the genes based on absolute moderated t-statistics, thus irrespective of the direction of gene expression modulation upon HDAC-inhibition. (B) FGS differentially expressed due to upregulated genes, as determined by signed t-statistics. (C) FGS differentially expressed due to downregulated genes, as determined by signed t-statistics.

An official website of the United States government
Here's how you know
Official websites use .gov
A
.gov website belongs to an official
government organization in the United States.
Secure .gov websites use HTTPS
A lock (
) or https:// means you've safely
connected to the .gov website. Share sensitive
information only on official, secure websites.
