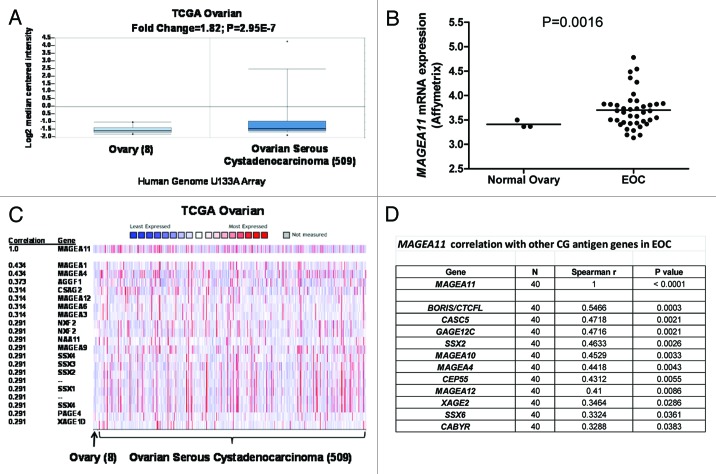
Figure 2.MAGEA11 expression in epithelial ovarian cancer (EOC). (A) Oncomine analysis of MAGEA11 mRNA expression in TCGA data 63. Fold change, P-value, and microarray platform is indicated. Data presentation is as described in Figure 1. (B) Oncomine analysis of the genes most closely correlated with MAGEA11 in TCGA data. (C) MAGEA11 mRNA expression was determined in three normal ovary samples and 40 EOC samples using Affymetrix HG 1.0ST microarrays. Two-tailed t-test results are shown. (D) Expression of MAGEA11 and other CG antigen genes was determined by Affymetrix microarray, as described in (C). Spearman test r values and P-values for correlation with MAGEA11 are shown.

An official website of the United States government
Here's how you know
Official websites use .gov
A
.gov website belongs to an official
government organization in the United States.
Secure .gov websites use HTTPS
A lock (
) or https:// means you've safely
connected to the .gov website. Share sensitive
information only on official, secure websites.
