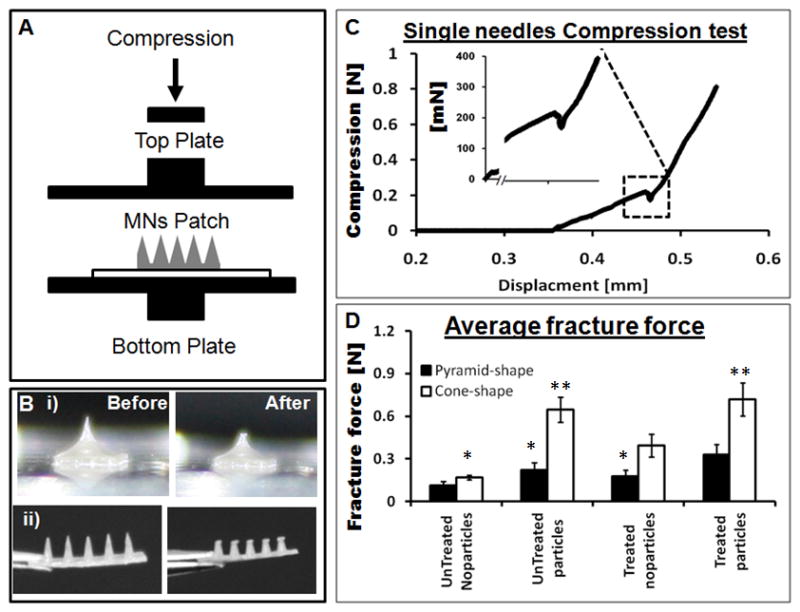
Figure 3.

A) Schematic of an axial mechanical test setup to assess MN device performance with two horizontal parallel plates. B) (i) and (ii) Digital images of pyramid and a cone shaped needles, respectively, before and after mechanical testing. C) A single needle compression test that breaks around 225 mN during compression. D) Fracture force of all sub-groups of the pyramid and the cone shaped MN fabricated by micromolding. (N = 10, error bars represent standard deviations) Significant effects are indicated by one (p < 0.05) or two stars (p < 0.01), the one start belong to same group and two stars belong to second group on the bases of 95% confidence interval using ANOVA.
