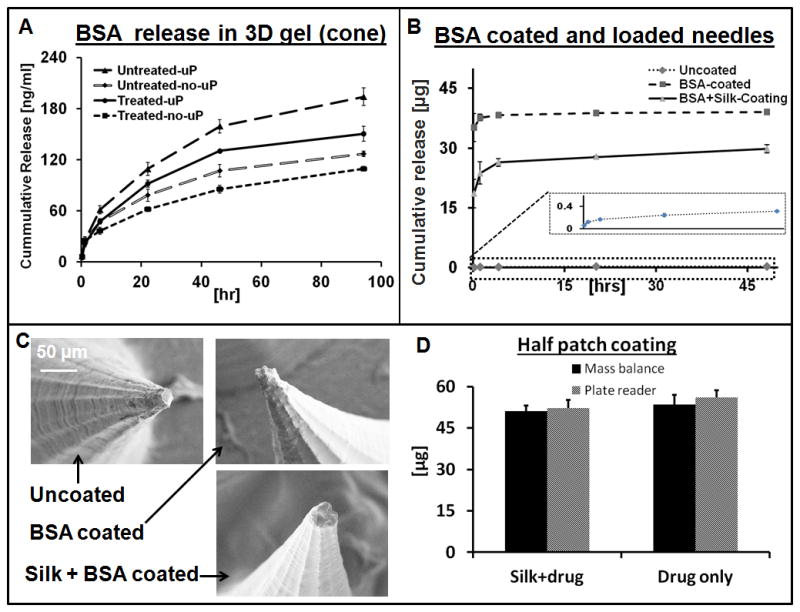
Figure 4.

BSA release from the silk MN in 3D collagen hydrogels, determined by digestion of collagen in collagenase solution followed by optical spectroscopy of the released BSA. A) Plots showing the release profile from cone shaped microneedles loaded with drug only and also microparticle containing same drug. B) Release kinetics of Drug loaded and coated MN patches. C) SEM digital images of the MN before and after coating with different drug solutions. D) Quantification of coated drug onto MN patch and verified by two separate techniques. (N = 3, error bars represent standard deviations).
