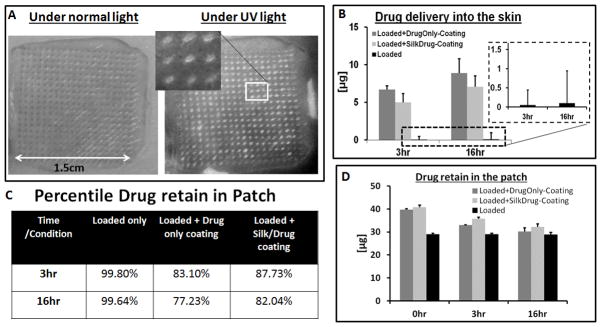
Figure 6.

A) Optical image of human cadaver skin treated with MN patch under normal and UV light, inserted image showing the magnified view of the position of needles fluorescent under UV light. B) Amount of drug delivered into the cadaver skin, inserted plot is the drug delivery from drug loaded patches without coating. C) Table of the drug retains in the MN patches after cadaver skin application. D) Total amount of drug per patch at different time point.
