Figure 2.

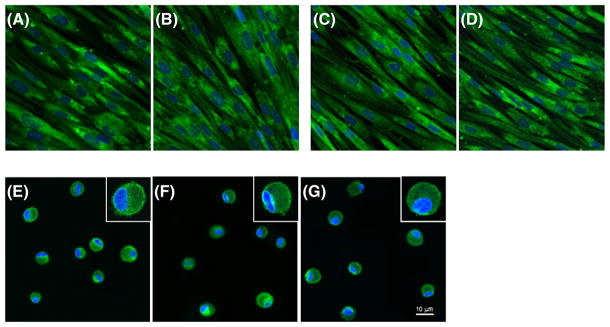
Cell morphology after 1 week of culture: (A) monoculture normal VFFs; (B) normal VFFs after co-culture with BM-MSCs; (C) monoculture scarred VFFs; (D) scarred VFFs after co-culture with BM-MSCs; (E) monoculture BM-MSCs in 3D HyStem–VF; (F) BM-MSCs in 3D HyStem–VF co-culture with normal VFFs; (G) BM-MSCs in 3D HyStem–VF co-culture with scarred VFFs. Cells were stained with p4h (green) and nuclei were counterstained with DAPI (blue). Scale bar = 10 μm
