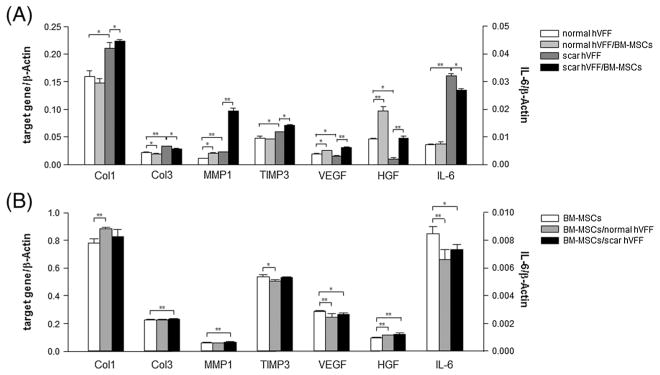
Figure 5.

Effect of co-culture on gene expression. After 24 h of monoculture and co-culture, gene expression was separately assayed for VFFs and BM-MSCs. Data are expressed as mRNA expression for collagen I (Col1), III (Col3), MMP-1, TIMP3, VEGF, HGF and IL-6 genes (ng/μl) relative to β-Actin (ng/μl). Values are expressed as mean ± SD of triplicate assays. *p <0.05; **p <0.01. (A) mRNA levels of monoculture normal and scarred VFFs, and BM-MSC co-cultured normal and scarred VFFs; (B) mRNA levels of monocultured BM-MSCs, and VFFs (normal and scarred) co-cultured BM-MSCs
