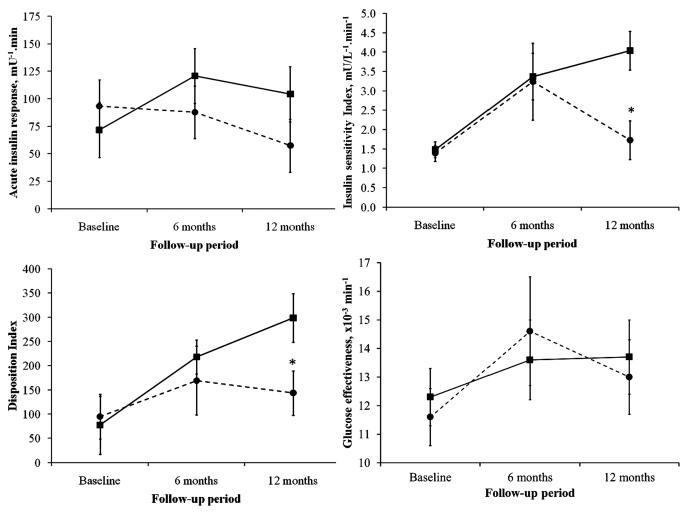
Figure 2.
Mean (SE) changes in key indices from frequently sampled intravenous glucose tolerance test derived from minimal model analyses from baseline to 12-month follow-up. *p<0.05 is for between-group differences at the indicated follow-up time-point. Interaction terms “interventions*follow-up period” were significant for acute insulin response to glucose (p=0.036) and insulin sensitivity index (p=0.037), but did reach significance for disposition index (p=0.053) and glucose effectiveness (p=0.741). ■ RYGB surgery • Diabetes Support and Education (DSE)

