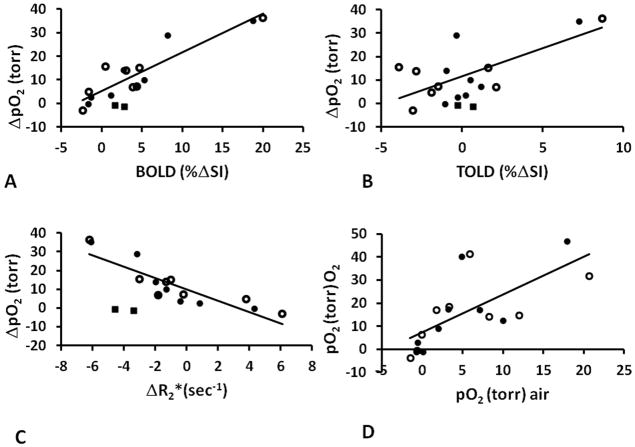
Figure 4. Correlation between BOLD, TOLD, and pO2 for 9 AT1 tumors.
Graphs show correlations between ΔpO2 and (A) BOLD (B) TOLD and C) ΔR2* in response to oxygen (●) and carbogen (○) challenges (Group 1 tumors). The HFB injection in one tumor (■) was in the center and the data were excluded from the correlations, as being unrepresentative of the whole tumor. D) Correlation between mean pO2 during oxygen (●) or carbogen (○) breathing and baseline air-breathing pO2.

