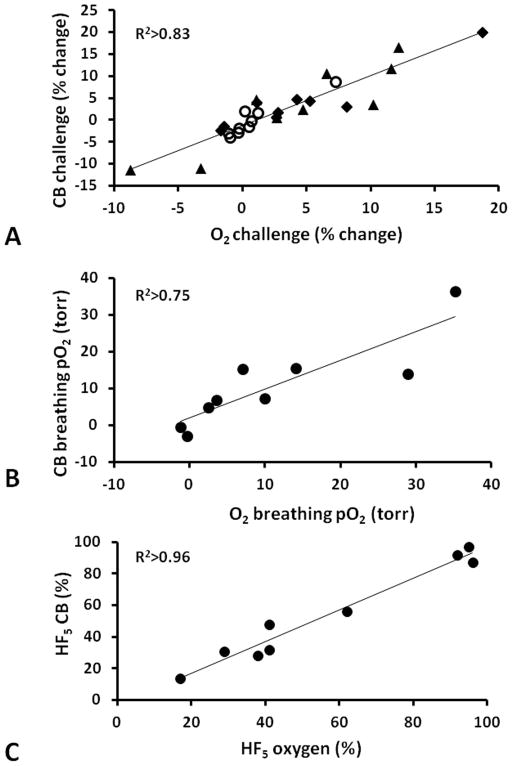
Figure 5. Comparison of response to oxygen and carbogen for 9 AT1 tumors.
A) Correlation between mean BOLD %ΔSI (◆), Δ%SI TOLD (○), and %ΔT2* (▲) responses for each tumor in Group 1 to oxygen and carbogen challenge assessed non-invasively using 1H MRI. B) Correlation between oxygen and carbogen in modulating tumor pO2 assessed using 19F MRI relaxometry following direct intratumoral injection of HFB reporter. C) Correlation between residual hypoxic fraction (pO2 < 5 torr) in individual tumors, while breathing oxygen or carbogen.

