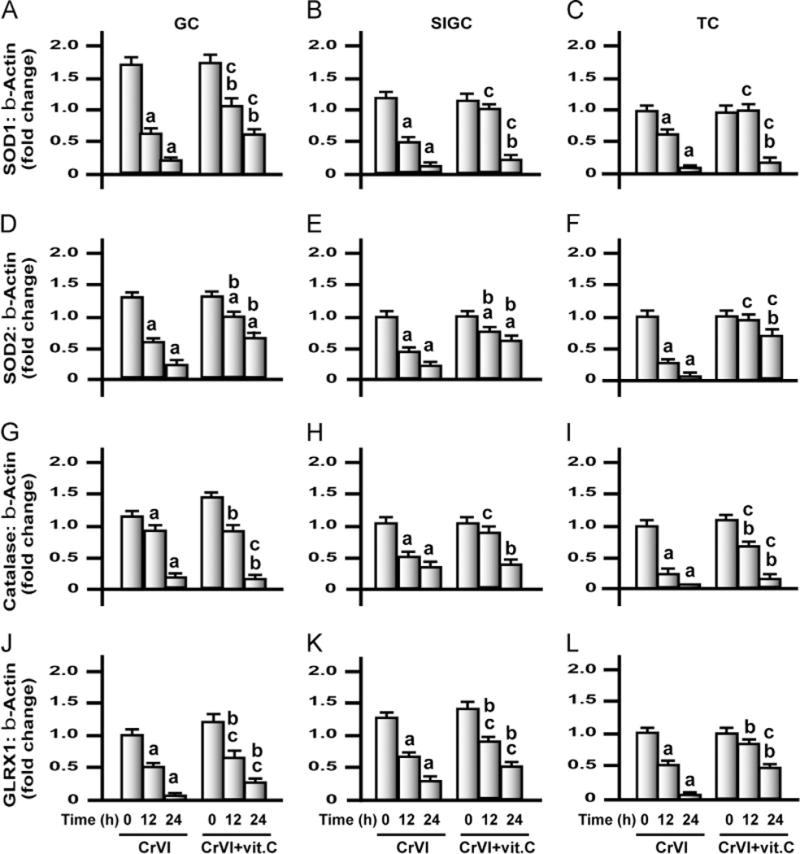
Fig. 10.

Effects of exposure to CrVI on mRNA levels of SOD1, SOD2, and catalase and GLRX1 in GCs, SIGCs, and TCs. GCs and TCs were isolated from control immature rats (PND 23–26), as described under Materials and methods. GCs, SIGCs, and TCs were cultured and treated with CrVI with or without vitamin C pretreatment, as described in the legend to Fig. 7. Histograms depict expression of SOD1 mRNA in (A) GCs, (B) SIGCs, and (C) TCs; SOD2 mRNA in (D) GCs, (E) SIGCs, and (F) TCs; catalase mRNA in (G) GCs, (H) SIGCs, and (I) TCs; and GLRX1 mRNA in (J) GCs, (K) SIGCs, and (L) TCs. CrVI treatment decreased mRNA expression of SOD1, SOD2, catalase, and GLRX1, and vitamin C pretreatment mitigated or inhibited the effects of CrVI treatment. Each value is the mean±SEM of three different samples per treatment, P<0.05. aCrVI treatment, 0 h vs 12 or 24 h; bCrVI+vitamin C (pretreatment), 0 h vs 12 or 24 h; cCrVI (12 or 24 h) vs CrVI+vitamin C (12 or 24 h).
