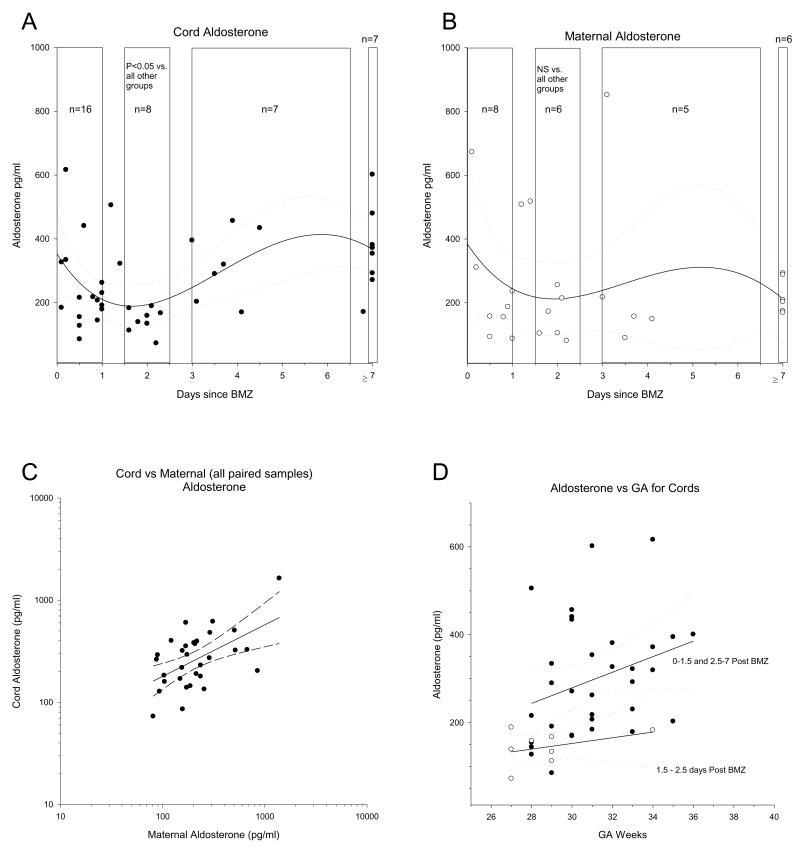
Figure 2.
Aldosterone values in maternal and fetal blood collected from deliveries according to Parker et al (15). The aldosterone levels in cord (upper left) and maternal (upper right) blood are shown. In both cases 3rd order regressions are shown with 95% confidence intervals to establish the initial minima. Note that while aldosterone does not drop immediately (consistent with acute aldosterone production being controlled by factors other than ACTH), there is a clustering of data points at a minima of 1.5-2.5 days, consistent with the known minima for cortisol and the data in Table 1. Data sets were subsequently compared as shown by the boxes. Only the cord blood set denoted in the period 1.5-2.5 days post BMZ was significantly different from all other groups (P<0.01). The relationship between cord aldosterone and maternal aldosterone are indicated bottom left; note linear regression with 95% confidence intervals are also shown. The relationship between aldosterone and gestational age in suppressed (open symbols 1.5-2.5 days post treatment) vs unsuppressed (solid symbols, 0-1.5 days or 2.5-7 or more days) are shown with linear regressions and 95% confidence intervals as indicated.

