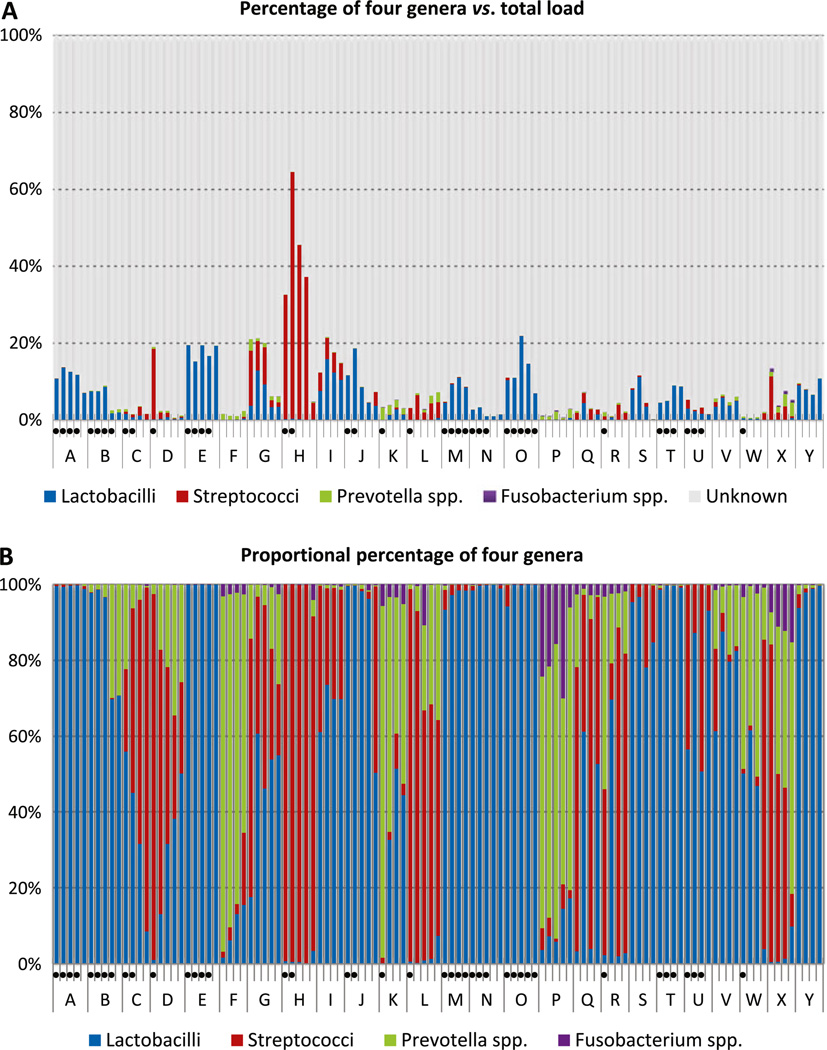
Fig. 2.
Contribution of four genera in carious samples. Samples from the same tooth are labeled under the same letter with the most superficial layer on the left and progressing to the deepest layer on the right. Dots below a sample indicate a pH below hydroxyapatite dissolution pH of 5.5. a Percentage of four genera versus total load of bacteria. b Proportional percentage of the four genera

