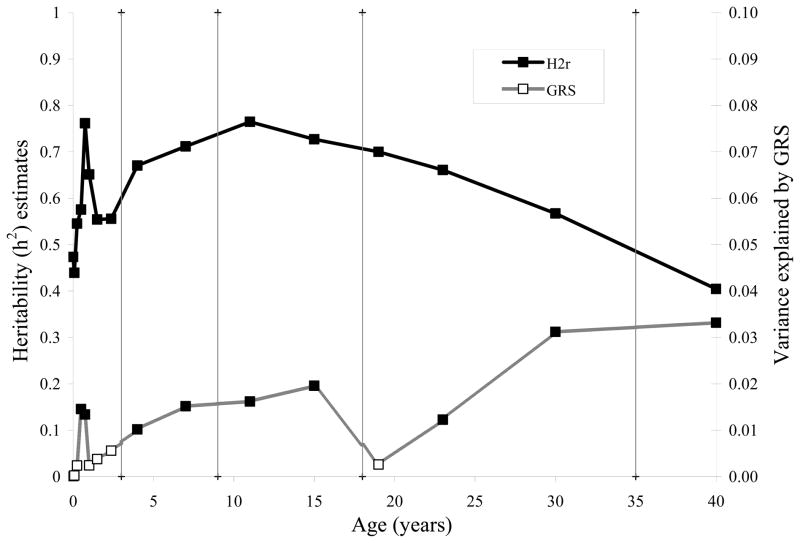
FIGURE 2.
Proportion of the variance explained by BMI variants (open squares, right axis) and additive genetic effects (h2) adjusting for BMI variants (solid squares, left axis), across age at birth, infancy (1, 3, 6, 9, 12, 18, and 28 months) childhood (4 and 7 years), adolescence (11 and 15 years), adulthood (19, 23, and 30 years) and mid-adulthood (40 years). All heritability estimates were significant (p < 5.3×10⁻⁵).

