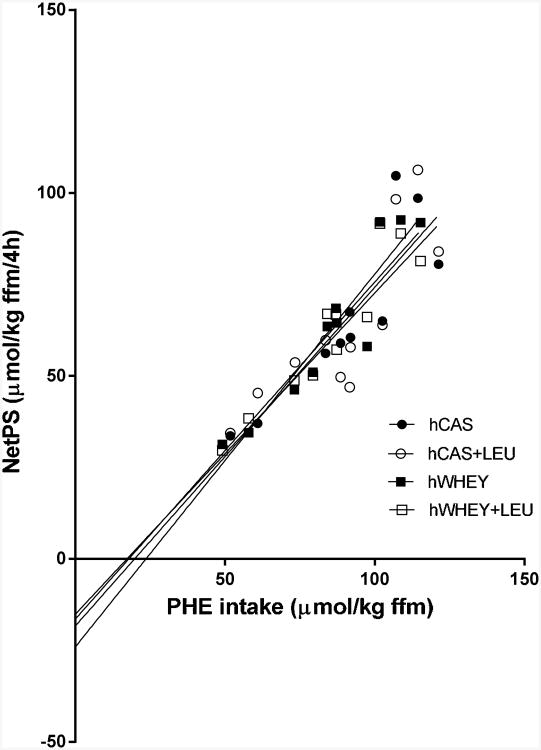
Figure 7.
Correlation between net protein synthesis (NetPS) expressed as the total amount over four hours and phenylalanine intake (PHE intake) of a hydrolyzed casein (hCAS) (r = 0.88; NetPS = 0.93 · PHE intake − 18.3), hydrolyzed casein with leucine addition (hCAS+LEU) (r=0.83; net NetPS = 0.88 · PHE intake − 15.1), hydrolyzed whey (hWHEY) (r=0.92; NetPS = 0.84 · PHE intake − 16.4), and hydrolyzed whey with leucine addition (hWHEY+LEU) (r=0.94; NetPS = 1.02 · PHE intake − 24.0) protein meal. All correlations were statistically significant (P<0.01) and linear regression showed no significant difference between the slopes (P=0.9374).

