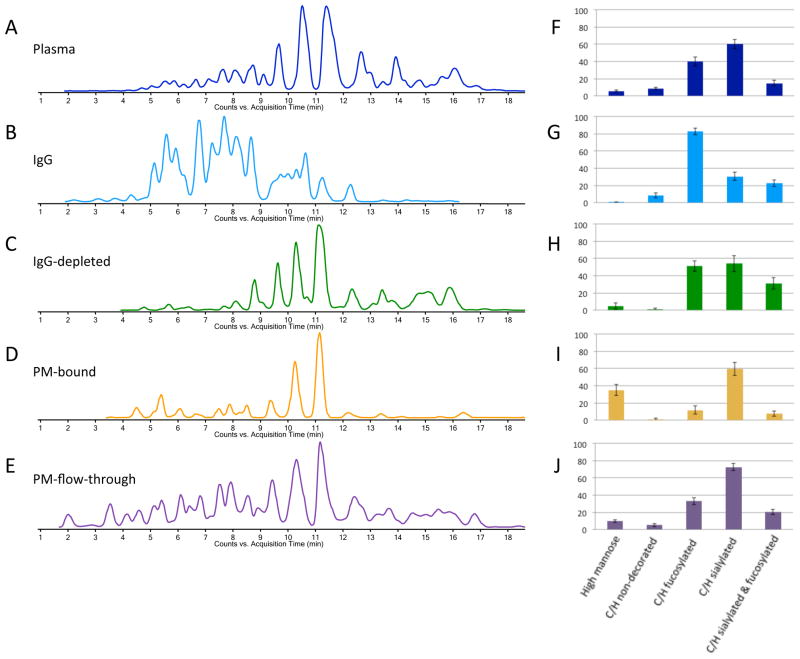
Figure 1. Comparison between total plasma (A,F), IgG (B,G), IgG depleted plasma (C,H), medium- abundant protein enriched fraction (D,I) and protein enrichment flow-through (E,J).
Extracted glycan chromatograms, obtained using Masshunter software are depicted (A–E), as well as bar graphs showing the relative abundances (%) of different compositional features of the N-glycans observed in each fraction (F–J).

