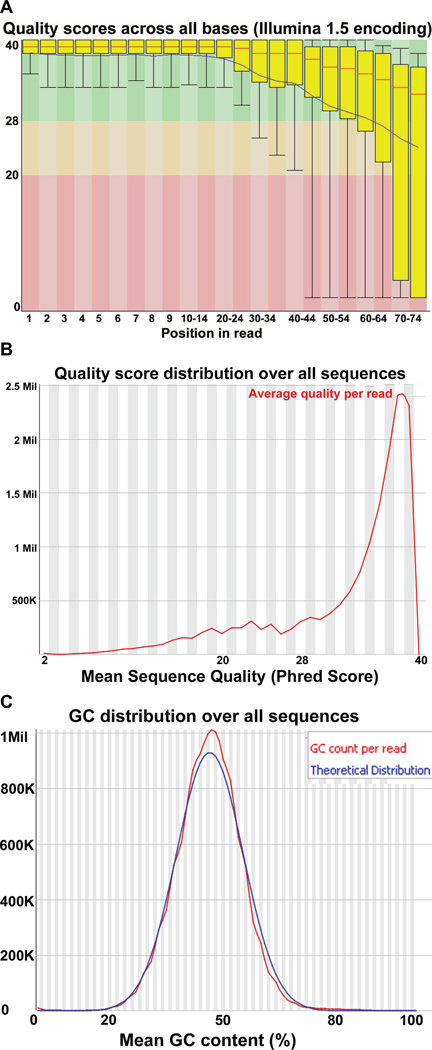
Figure 3. Output from fastqc software for RNA-seq data quality analysis.
(A) Quality score per base position for reads. x-axis represents base pair position and y-axis represents interquartile range of quality value (from 0 to 40). Note the overall reduction in quality of scores toward the end of the 76 bp reads. (B) Graphical summary of quality scores shown in (A). (C) G/C distribution over all sequence reads represented on x-axis, with total reads corresponding on y-axis. Overall distribution (red line) versus the theoretical distribution in sample (blue line).

