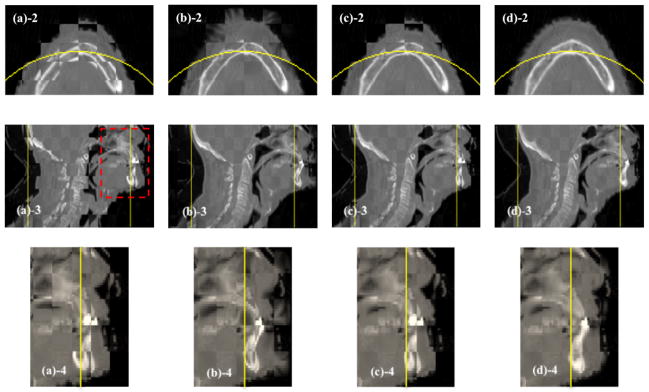
Figure 4.


Checkerboard comparisons of the DIR results (Case 5). Columns: (a) ; (b) ; (c) ; (d) . Rows: (a)-1 ~ (d)-1: transverse images; (a)-2 ~ (d)-2: zoomed-in views of the transverse images; (a)-3 ~ (d)-3: sagittal images; (a)-4 ~ (d)-4: zoomed-in views of the sagittal images. Circles in (a)-1 ~ (d)-1 and lines in (a)-3 ~ (d)-3 indicate the FOV after truncation, and the dashed rectangles indicate the regions to be zoomed in.
