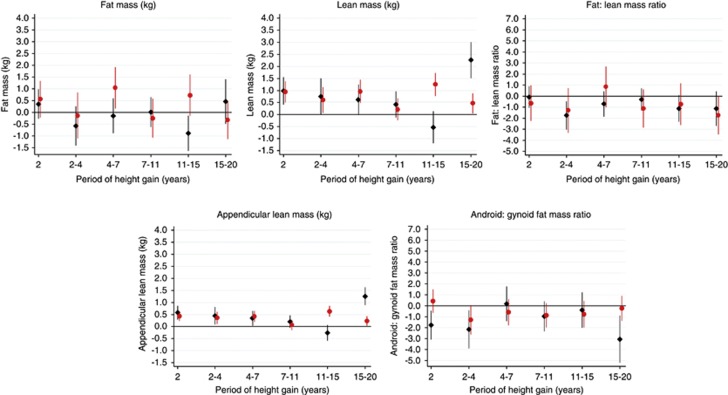
Figure 2.
Mean differences in body composition outcomes at age 60–64 years (with 95% confidence intervals) per standard deviation increase in height at age 2 and height gain velocity (adjusted for height and weight at the beginning of each period and concurrent weight gain velocity). Notes: males=black diamonds; females=gray/red circles; sample sizes in the different periods were (male/female): 2 (593/627); 2–4 (561/580); 4–7 (574/615); 7–11 (573/622); 11–15 (543/588); 15–20 (500/555); associations with height at 2 years were adjusted for weight at 2 years only. The full colour version of this figure is available at International Journal of Obesity online.

