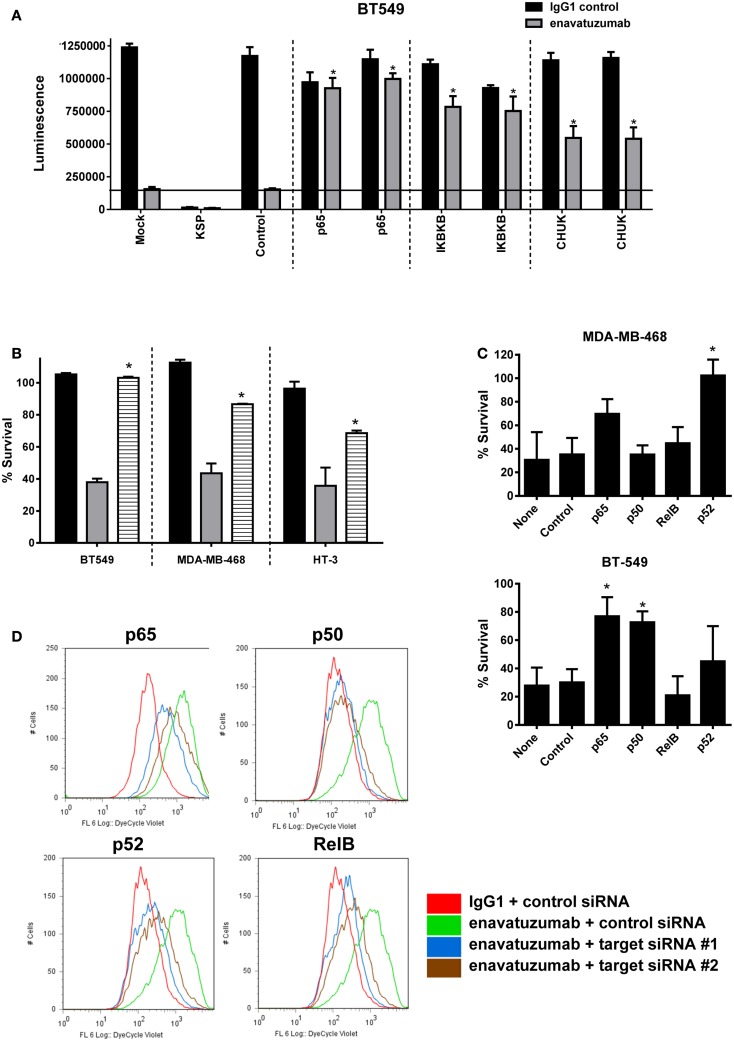
Figure 5.
Inhibition of NFκB activation prevents the growth inhibitory activity of enavatuzumab. (A) BT549 cells were transfected with two different siRNAs against p65 or upstream kinases IKK1 (IκBKβ), IKK2 (CHUK). Transfection controls were non-targeting control (negative) or KSP (positive control for transfection efficiency). After 48 h, cells were treated with enavatuzumab or IgG1 control at 10 μg/mL for an additional 5 days in the presence of anti-human crosslinking antibody (3.5 μg/mL), and the cell viability was determined. siRNA significantly reduced growth inhibition by enavatuzumab, compared to mock or control siRNA transfected cells (horizontal line) (*p-value < 0.05). (B) Enavatuzumab sensitive lines were treated with IKK inhibitor IKK16 at 160 nM (black bars), enavatuzumab/crosslinker (gray bars), or IKK16 plus enavatuzumab/crosslinker (striped bars) and % survival was measured after 5 days. IKK16 significantly blocked growth inhibition by enavatuzumab compared to enavatuzumab alone (*p-value < 0.05). (C) Targeting individual NFκB subunits (p50, p65, RelB, p52) by siRNA reduced enavatuzumab activity in sensitive cell lines (MDA-MB-468 and BT549). Cells were transfected with pooled targeting siRNA or control siRNA for 48 h, prior to treatment with enavatuzumab or IgG1 control for 5 days in the presence of a crosslinking antibody. Percent survival was calculated from the relative viability of cells treated with enavatuzumab versus control-treated cells (*p-value < 0.05). (D) The effect of NFκB induced by enavatuzumab on cell division was investigated by pre-labeling HT3 cells with the Cell Trace™ reagent. Cells treated with enavatuzumab/crosslinker (green line) are compared to the IgG1 control-treated cells (red line). Cells transfected with two different siRNAs to p65, p50, p52, or RelB and treated with enavatuzumab/crosslinker (blue and brown lines) are also displayed.

