
Figure 11.
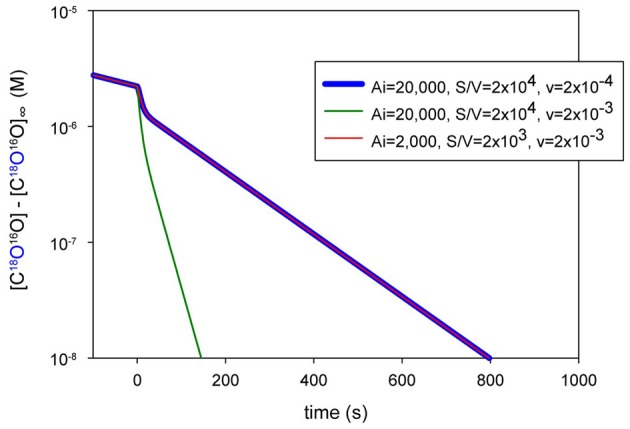
Calculated mass spectrometric recordings for three different conditions of hematocrit and intracellular activity. Blue curve: human red cell hematocrit of 0.02% with intracellular activity Ai of 20,000. Green curve: hematocrit of 0.2% with Ai = 20,000. Red curve (superimposed to the blue curve): hematocrit of 0.2% with Ai = 2000 and 10 times smaller surface-to-volume ratio S/V, similar to what is exhibited by MDCK cells etc. Y-axis: actual concentration of C18O16O at a given time minus its concentration [C18O16O]∞ after isotopic equilibrium has been reached.