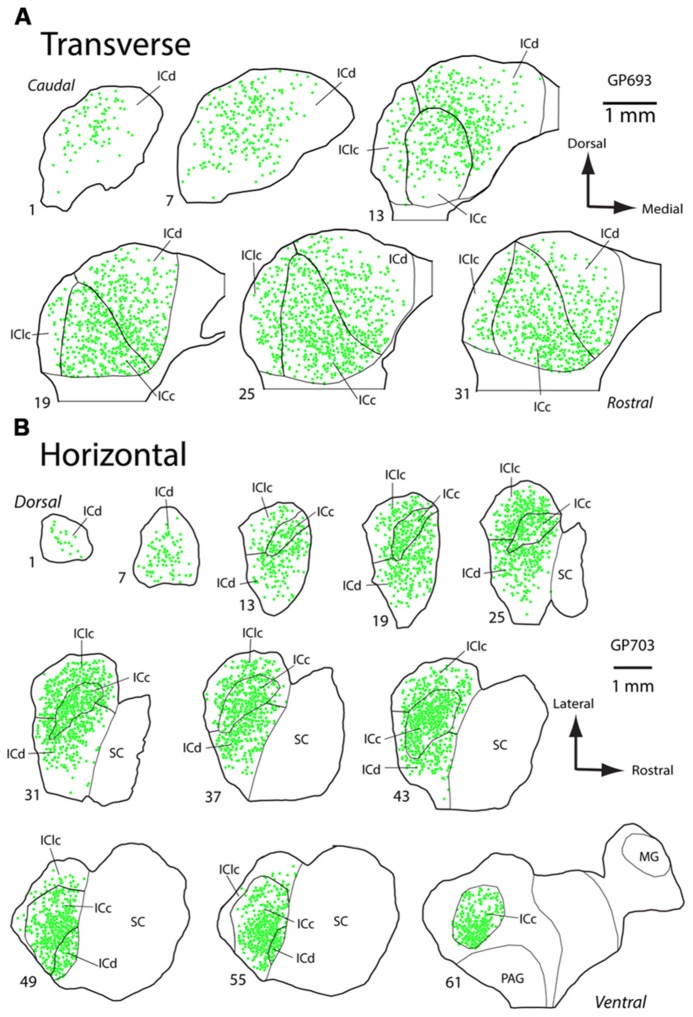
FIGURE 2.
Plots of WFA-labeled PNs in the inferior colliculus (IC). (A) Plot showing the distribution of WFA-labeled PNs (green circles) in transverse sections through the IC. Sections progress from caudal to rostral. Medial is right, dorsal is up. Scale bar = 1 mm. Case GP693. (B) Plot showing distribution of WFA-labeled PNs (green circles) in horizontal sections through the IC. Sections progress from dorsal to ventral. Rostral is right, lateral is up. Scale bar = 1 mm. Case GP703.

