Fig. 3.
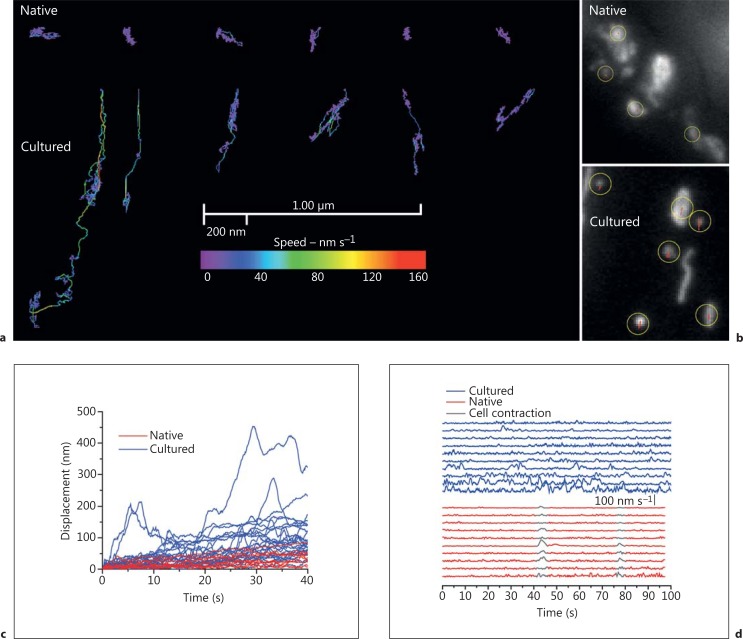
Mitochondria are largely immobile in native and highly dynamic in cultured cerebral resistance artery smooth muscle cells. a Motion tracks of the 6 most motile mitochondria from native cells (top) are compared with the organelles' typical movement in cultured cells (bottom). The plot shows the x-y displacement and velocities of each mitochondrion. Mitochondria in native cells show almost no movement, whereas those in cultured cells engage in brief bursts of motion at speeds of ∼160 nm s-1, resulting in substantial movement of the organelle. b To provide a sense of scale of the movement the motion tracks (in red) are overlaid on the mitochondria images. The yellow circles show the position of the mitochondria's centre in the first frame of the sequence. The red motion tracks on the mitochondria of the native cells are ∼1 pixel and so difficult to visualize. c The displacement of the tracked mitochondria plotted as a function of time. Displacement is defined as the distance between the position of an organelle at time t and at time t = 0. Mitochondria in cultured cells (blue) undergo bursts of motion that cover large distances when compared to the displacement of mitochondria within the native cells (red). d The instantaneous speed of tracked mitochondria (native, red; cultured, blue) was measured by comparing the organelles position over 1-second intervals. The speeds have been separated in the vertical axis for clarity. Aside from two global motion events due to slight contraction of the entire cell (shown in grey) the mitochondria in the native cell are inactive. In the cultured cell many bursts of high-speed motion occurred with a maximum speed of typically 100 nm s-1. In all experiments TMRE was used to visualise mitochondria and the experiments were carried out at room temperature [from Chalmers et al., [26]].

