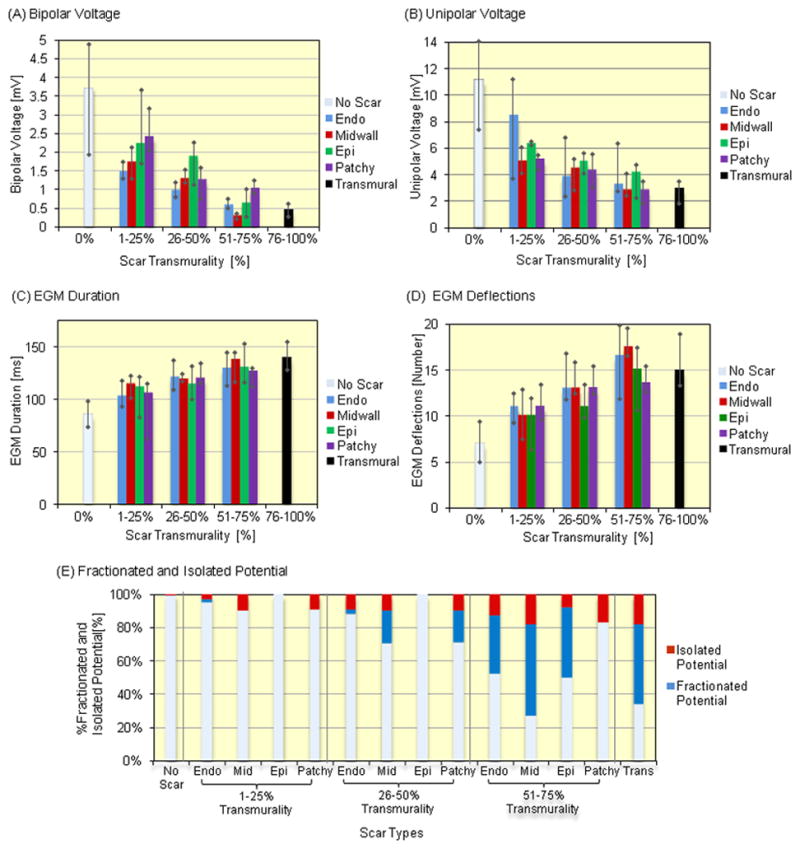
Figure 3.

Associations between Scar on LGE-CMR and Local Electrograms – The figure illustrates the association of EGM parameters or fractionated and isolated potentials with scar types. (A) Bipolar and (B) unipolar EGM voltages were negatively associated with endocardial, mid wall, epicardial and patchy scar transmurality (P<0.0001, respectively, test for trend). (C) EGM duration and (D) deflections were positively associated with endocardial, mid wall, epicardial and patchy scar transmurality (P<0.0001, respectively, test for trend). The bar graphs show the median and the error bars reflect the interquartile range. (E) Fractionated and isolated potential were more frequently observed in scar regions with greater scar transmurality (P<0.0001, test for trend).
