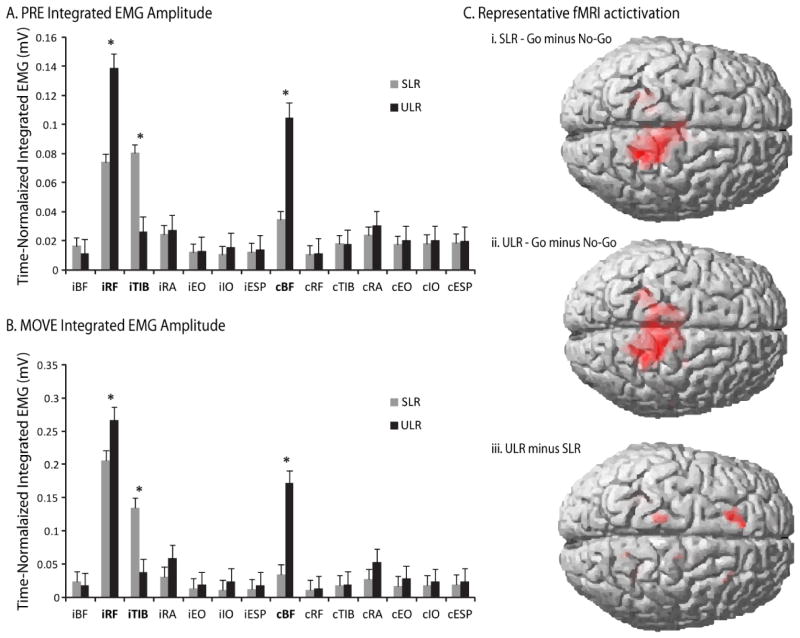
Figure 2.
Summary of results. A) Mean integrated EMG amplitudes during the PRE epoch where the vertical axis represents the integrated EMG amplitudes of each muscle in millivolts and the horizontal axis lists each muscle with a prefix of “i” or “c”, representing the ipsilateral or contralateral side of the body, respectively. The black bars represent the grand averages for the ULR, and the gray bars represent the grand averages for the SLR; Muscles with significant task-by-epoch-by-muscle interactions are highlighted in bold text. B) Mean integrated EMG amplitudes during the MOVE epoch with the vertical and horizontal axes defines as in (A), and; C) Representative fMRI activation for “Go” minus “No-go” conditions during the SLR (i) and ULR (ii) tasks and for the “Go” condition of the ULR task minus the “Go” condition of the SLR task (iii). Red shaded areas indicate significance at the P < 0.05 level.

