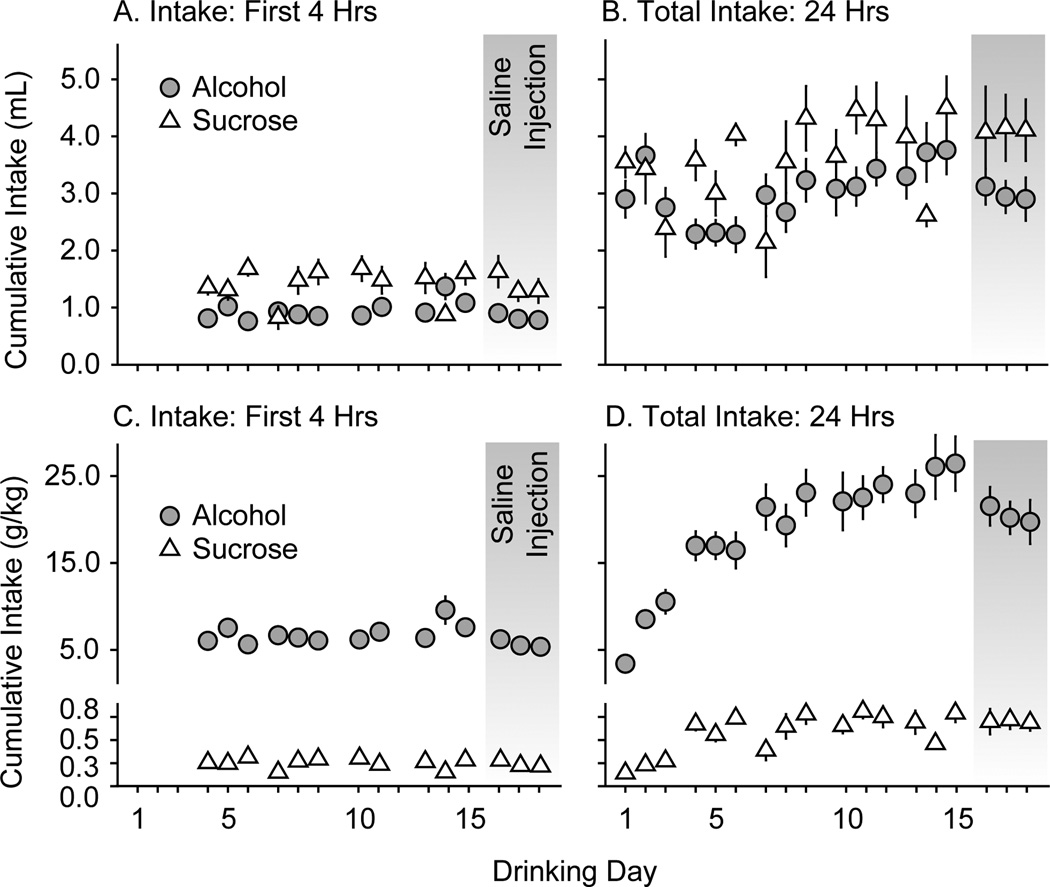
Figure 3.
Habituation to alcohol and sucrose drinking in experiment 2. Mice had access to two bottles placed into their home cages for 24 h on Monday, Wednesday, and Friday. One bottle contained alcohol (gray circles, n = 11 mice) or sucrose (white triangles, n = 12 mice); the other bottle contained tap water. Data are expressed as mean cumulative volume (ml, top panelsA and B) or quantity (g/kg, bottom panelsC and D) of alcohol and sucrose intake ± SEM (vertical lines). On the first three drinking days, mice had access to escalating concentrations of alcohol (3, 6, 10% w/v) or sucrose (0.1, 0.17, 0.3 % w/v). On subsequent drinking days, mice had access to 20% alcohol (w/v) or 0.5% sucrose (w/v). Left panels (A and C) show cumulative intake during the first four hours of drinking. Right panels (B and D) show cumulative intake during the entire 24 hours of drinking. Saline injections (i.p.) were administered 30 min prior to the drinking session on the 16th, 17th, and 18th drinking days (gray shading).

