
Figure 2.
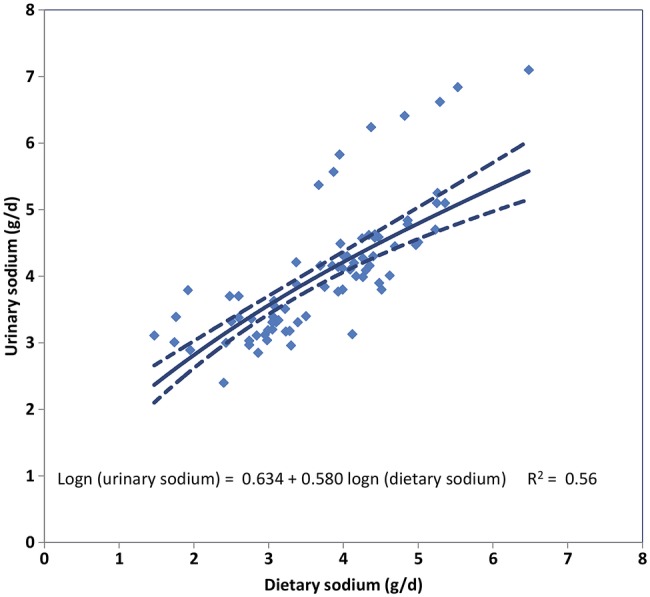
Relationship between measured urinary sodium and measured dietary sodium in 79 age/sex strata from 26 survey pairs. Note: The solid line represents the cross-walk regression line (linear regression of log-transformed urinary sodium on log-transformed dietary sodium); and the dotted lines, the 95% uncertainty intervals. With the partial exception of 8 age and sex strata (all from 2 of the 3 InterMap study sites in China) in which urinary sodium levels were systematically higher relative to their dietary levels, good agreement was seen between the two metrics. The regression coefficients obtained from this analysis informed the Bayesian hierarchical model of the relationship between the two metrics. Adding a term to identify the survey sites generating the outlying points increased the R2 to 0.79 but it was not retained because this term did not correspond to a generic survey characteristic that could be used in predictions outside the cross-walk dataset. The wider uncertainty bounds for the modelled relationship in the upper part of its range reflect the influence of the outliers.