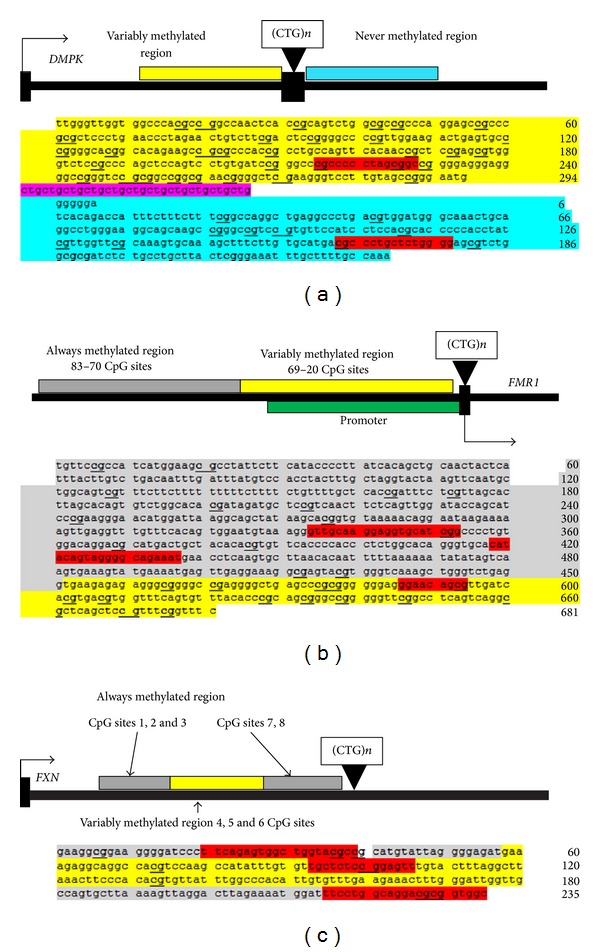
Figure 1.

This figure shows the 3 gene regions under investigation: (a) DMPK 3′ UTR region, (b) FMR1 5′ UTR region, and (c) FXN intron 1 region. A scheme of the DNA sequence, transcriptional start site, and the regions analysed are shown. The grey shading shows the always methylated (AM) regions, blue shows the never methylated (NM), and the yellow area shows variably methylated (VM) regions. CpG sites are underlined and bold numbers at start and end of each line show base pair number in the sequence. A triangle shows the location of repeat expansion and the box above triangle shows the TNR repeats. The green highlighted region in the FMR1 gene indicates the promoter region. The CTCF binding sites are shown in red.
