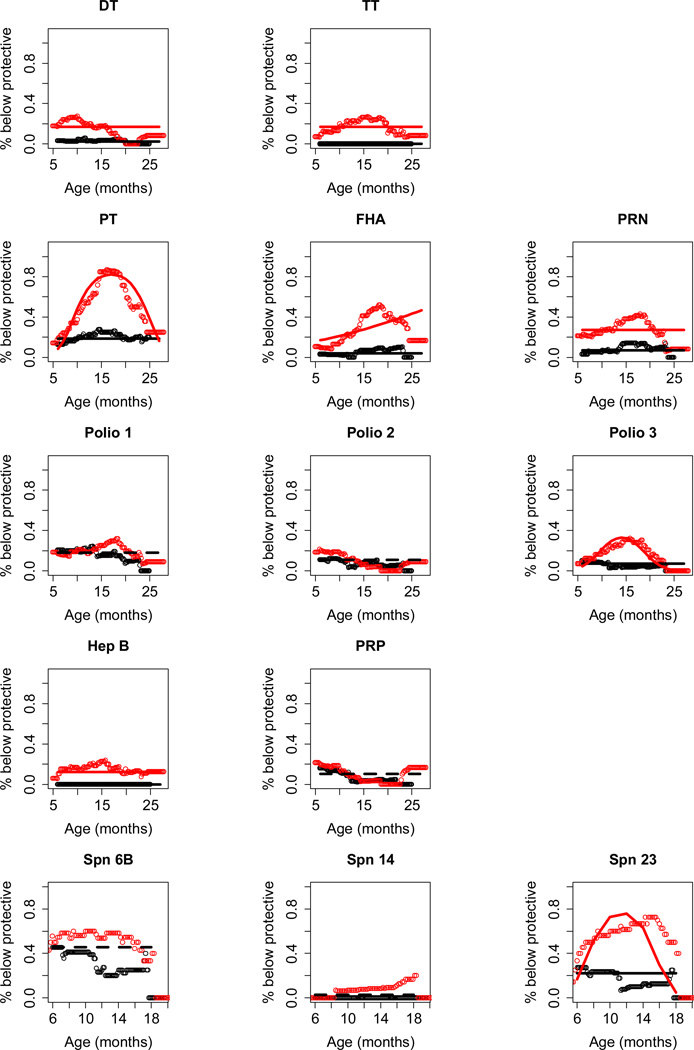
Figure 1. Percent of sOP children (red color) and non-sOP children (black color) with antibody below protective levels plotted against age of the child.
sOP children more frequently had non-protective levels of antibody but no time gradient for DT, TT, PRN and HepB (see Table 2b for statistics). The sOP children more frequently had non-protective levels of antibody for PT, FHA, polio 3 and Spn 23F, but the group effect varied with age (see Table 2c for statistics). sOP and non-sOP children responded similarly to polio 1, polio 2, PRP or Spn polysaccharide serotypes 6B and 14 (see Table 2a for statistics) when calculated using the GEE model.

