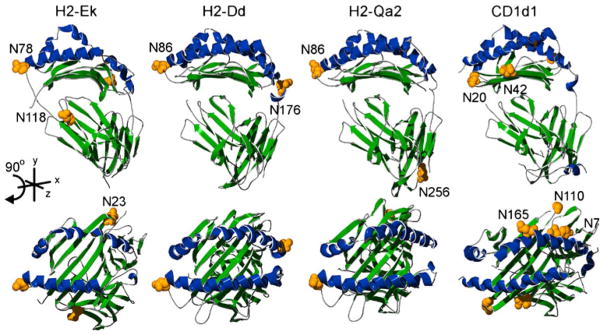
Fig. 3.

Structural comparison of mouse MHC molecules. Images were created using previously defined crystal structures of mouse H2-Ek (pdb|3QIB), H2-Dd (pdb|3E6F), Qa2 (pdb|1K8D), and CD1d1 (pdb| 3HE6). Alpha helices of the antigen binding groove are shaded blue and the rest of the molecule in green. The upper panel shows lateral views with the corresponding top view of each molecule found directly below. Putative N-glycan acceptor sites are shaded yellow and shown as space-filled residues. The N7 and N110 designations on CD1d1 show the approximate locations of the asparagine residues due to missing coordinate data in the available PDB structure file
