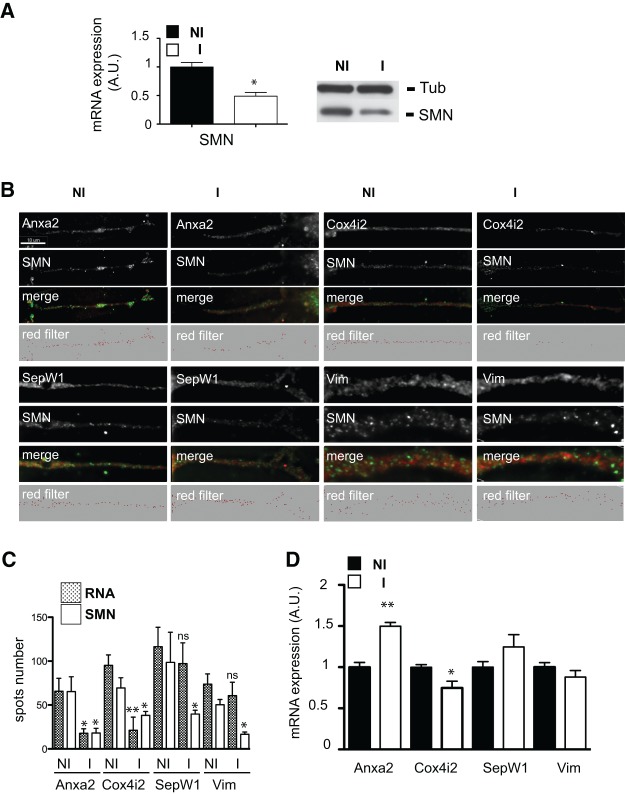
FIGURE 6.
Localization of distinct mRNAs in neurites of differentiated shSMN-NSC-34 cells is not affected at the same level upon SMN deficiency. (A) RT-PCR (left panel) and Western blot analysis (right panel) of SMN mRNA and protein levels in noninduced and induced differentiated shSMN-NSC-34 cells. (B) Spots corresponding to the indicated mRNAs (red) and colocalizing with the endogenous SMN protein (green spots) in neurites of noninduced (NI) or induced (I) shSMN-NSC-34 cells are shown (merge). Imaris-generated images (red filter) show the amounts of RNA spots localized in neurites before and following SMN depletion. Scale bar, 10 μm. (C) Histograms showing the average number ± SEM of SMN and RNA spots in neurites of noninduced (NI) or induced (I) shSMN-NSC-34 cells. (*) P-value <0.05; (**) P-value <0.01; (ns) nonstatistically significant. (D) RT-PCR analysis of Anxa2, Cox4i2, SepW1, and Vim mRNA levels in SMN-depleted NSC-34 cells. Histograms showing the percentage ± SEM (n = 3) of variation for the indicated mRNA in induced (I) compared with noninduced (NI) cells. (*) P-value <0.05; (**) P-value <0.01.

