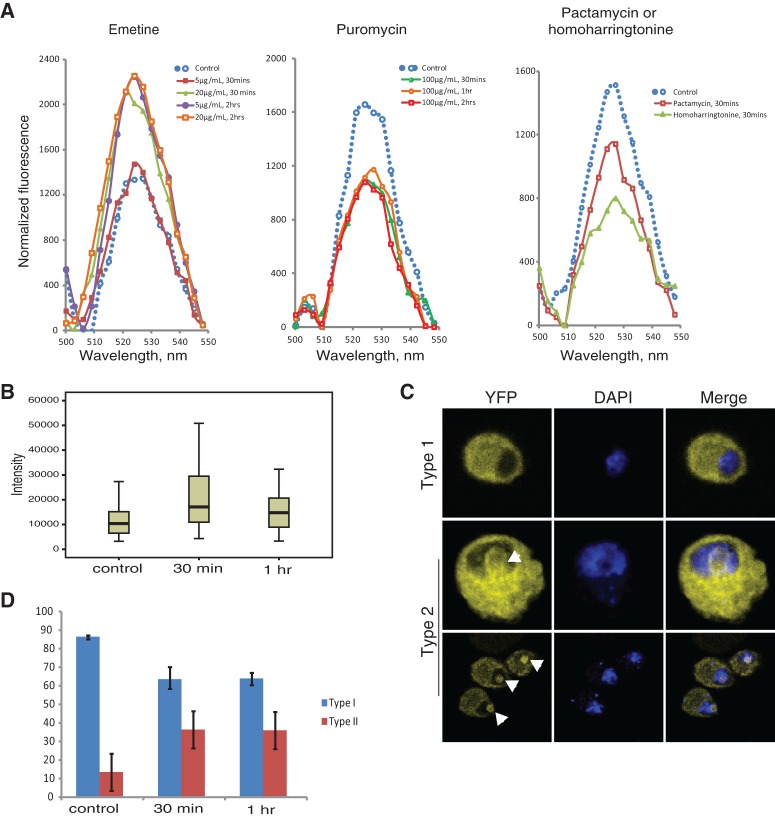
FIGURE 4.
Translation affects S18–L11 interaction. (A) Fluorescence emission spectra, 500–550 nm, in extracts of transfected cells pre-incubated prior to lysis with or without the indicated drug. The three experiments were performed with different batches of transfected cells, which were split into aliquots. Incubation with emetine (5 µg/mL or 20 µg/mL) was for 30 min or 2 h with puromycin (100 µg/mL) for 30 min, or 1 or 2 h; and with 2 µM pactamycin or 1 µM harringtonine for 30 min. The fluorescence of each sample was normalized as in Figure 3B. (B) Boxplots showing whole-cell mean fluorescence intensities of 100 transfected cells after 50 µg/mL emetine treatment, for 30 min and 1 h, and a control without the drug. Cells were manually defined as regions of interest (ROI) and mean fluorescence values were obtained using the Automated Measurement Results function of the Nikon NIS-BR Software. Values were corrected by subtracting the intensities in identical ROIs defined in adjacent regions without cells. (C) Confocal images of cells pretreated prior to fixation with 50 µg/mL emetine for the time indicated. Arrow indicates nucleolus. (D) Relative frequencies of Type 1 (blue) and Type 2 (red) cells with and without the indicated treatment with 50 µg/mL emetine. One hundred cells were counted from two separate transfections; standard deviations are indicated.

