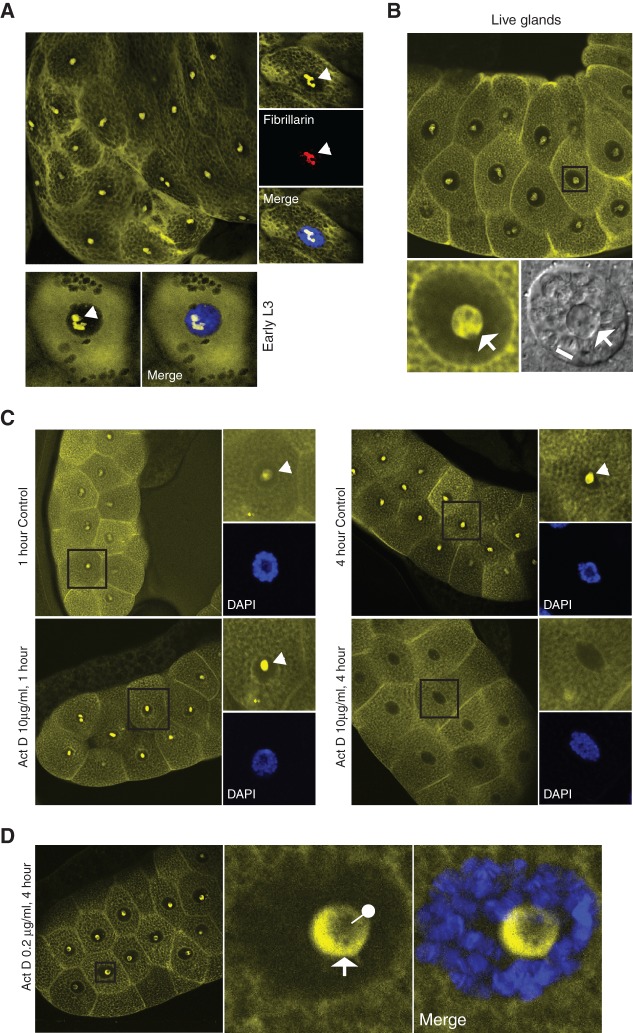
FIGURE 6.
Visualization of 80S in salivary glands. (A) Main panel shows a confocal image of YFP fluorescence in a fixed 3rd instar larva salivary gland, expressing S18–YN and L11–YC (driven by fork-head Gal4). These gland cells are replete with secretory vesicles. Right inset shows a high-magnification cell (from a different gland) in which fibrillarin (red signal) was detected by indirect immunostaining with a Cy5-conjugated antibody. Bottom row shows a younger gland cell with only a few vesicles. DAPI is shown in blue. Arrow indicates the nucleolus. (B) Confocal YFP image of live salivary glands. Bottom left shows a close-up view of the cell in the square; and bottom right is a confocal reflection image of the same cells showing a pseudo brightfield view of the chromosomes (the line indicates a segment of a chromosome arm with visible banding) and nucleolus (arrow). (C) Confocal images of glands treated with a high concentration of actinomycin D (10 μg/mL) for 1 or 4 h, compared with an untreated control gland. (D) Confocal images of a gland treated with a low concentration of actinomycin D (0.2 μg/mL) for 4 h. Right insets show higher magnification images of the boxed cells from the left-hand images. Arrow indicates the surface of the nucleolus and the pin its dimmer core.

