Figure 3.
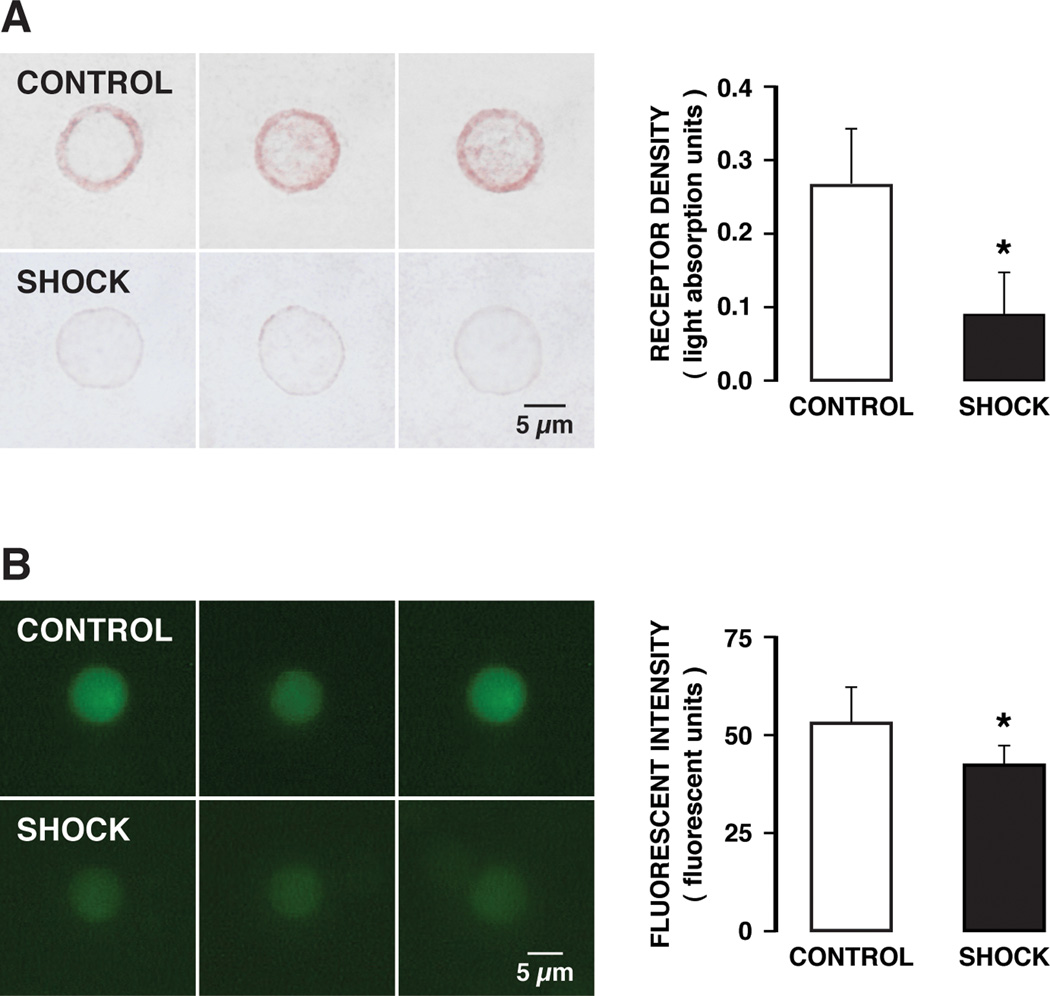
(A). (Left) Micrographs of naïve circulating leukocytes with immuno-histochemical label against the extracellular binding α-domain of insulin receptor before (CONTROL) and after (SHOCK) incubation in plasma of rats collected two hours after hemorrhagic shock. Note the strong reduction of the extracellular domain binding sites of the receptor in shock plasma. (Right) Receptor density measured by quantitative light absorption under standard light conditions. (90 cells/rat with 3 rats). *p<0.01. B). (Left) Micrographs of cytoplasmic fluorescent intensity by non-hydrolyzable glucose analog after uptake into naïve circulating leukocytes before (Control) and after (Shock) incubation in plasma of rats collected two hours after hemorrhagic shock. The incubation in fluorescent glucose was for 30 min in all groups. (Right) Cytoplasmic fluorescent intensity in digital units measured under standard light conditions showing significantly reduced cytoplasmic glucose levels after shock (300 cells/rat with 3 rats). *p<0.03.

