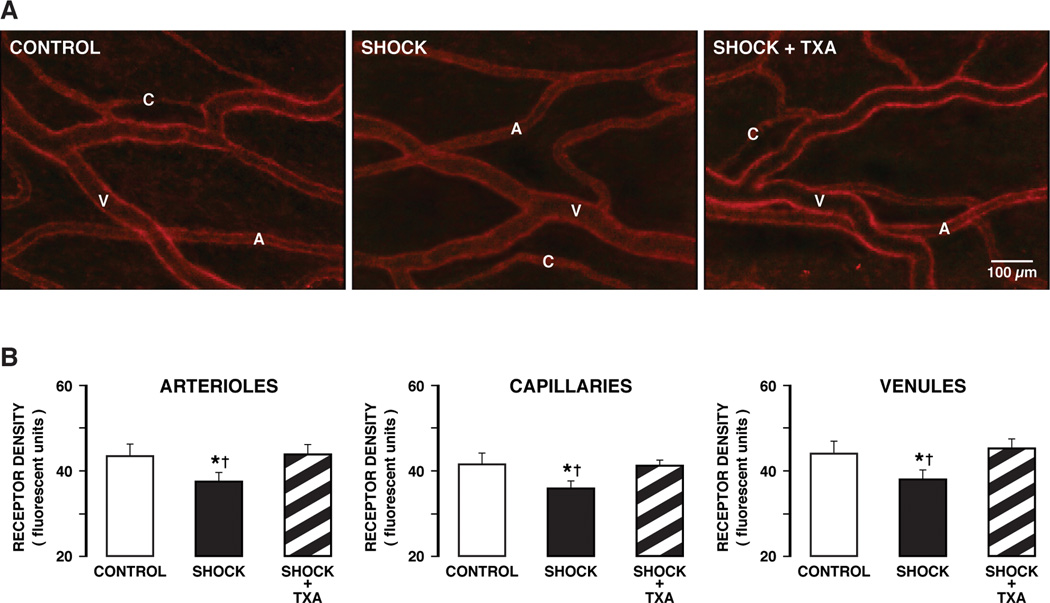
Figure 4.

(A) Fluorescent micrographs of whole mount mesentery specimens showing the cellular distribution of the insulin receptor in control animals (CONTROLS) and 2 hours after hemorrhagic shock without (SHOCK) and with (SHOCK + TXA) pancreatic digestive enzyme inhibition. The density of the insulin receptor in control tissue shows staining uniformly along individual microvessels (A, arterioles; C, capillaries; V, venules). (B) Fluorescent intensity values of the insulin receptor label density over randomly selected arterioles, capillaries, and venules of the mesentery. The microvessel sample size was 10–15 for each vessel type (arterioles, capillaries, venules) in each group. (3 animals per group) †p< 0.05 SHOCK vs CONTROL, *p< 0.05 SHOCK vs SHOCK + TXA.
