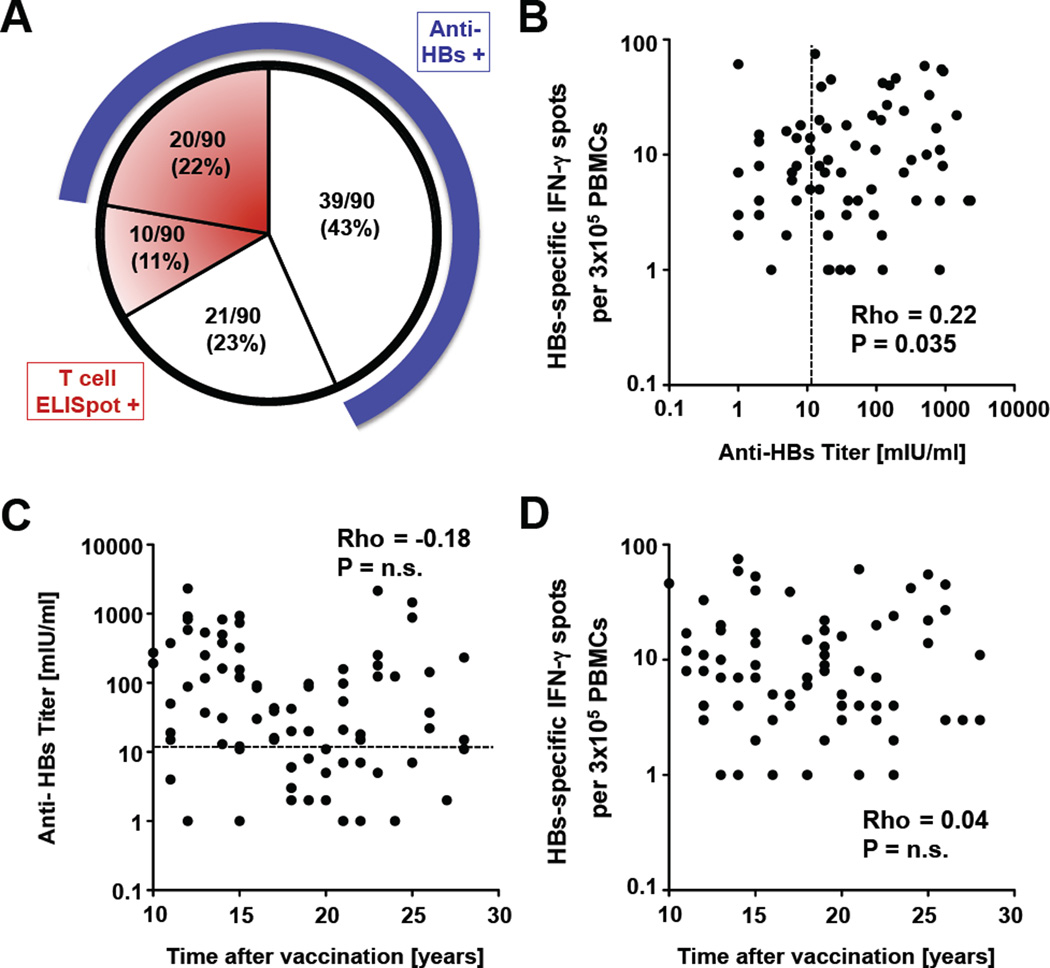
Figure 1. HBs-induced antibody responses correlate with HBs-specific T cell responses but not with time after vaccination.
(A) Characterization of the vaccinee cohort. HBs-specific antibody responses were tested by EIA and T cell responses by IFN-γ ELISpot. Number and percentage of vaccinees with (shaded areas) and without (clear area) HBs-specific T cell responses at the time of this study are indicated in the pie chart. The blue band around the circle represents the subgroup of vaccinees with anti-HBs responses > 12 mIU/ml. (B) Correlation between the strength of the HBs-specific IFN-γ T cell response and HBs-specific antibody response of health-care workers tested 10 to 28 years after vaccination. (C, D) Correlation between the HBs-specific antibody response (C) or the strength of the HBs-specific IFN-γ T cell response (D) and the time after vaccination. Statistical analysis: nonparametric, Spearman correlation. The dotted line indicates an antibody level of 12 mIU/ml.

