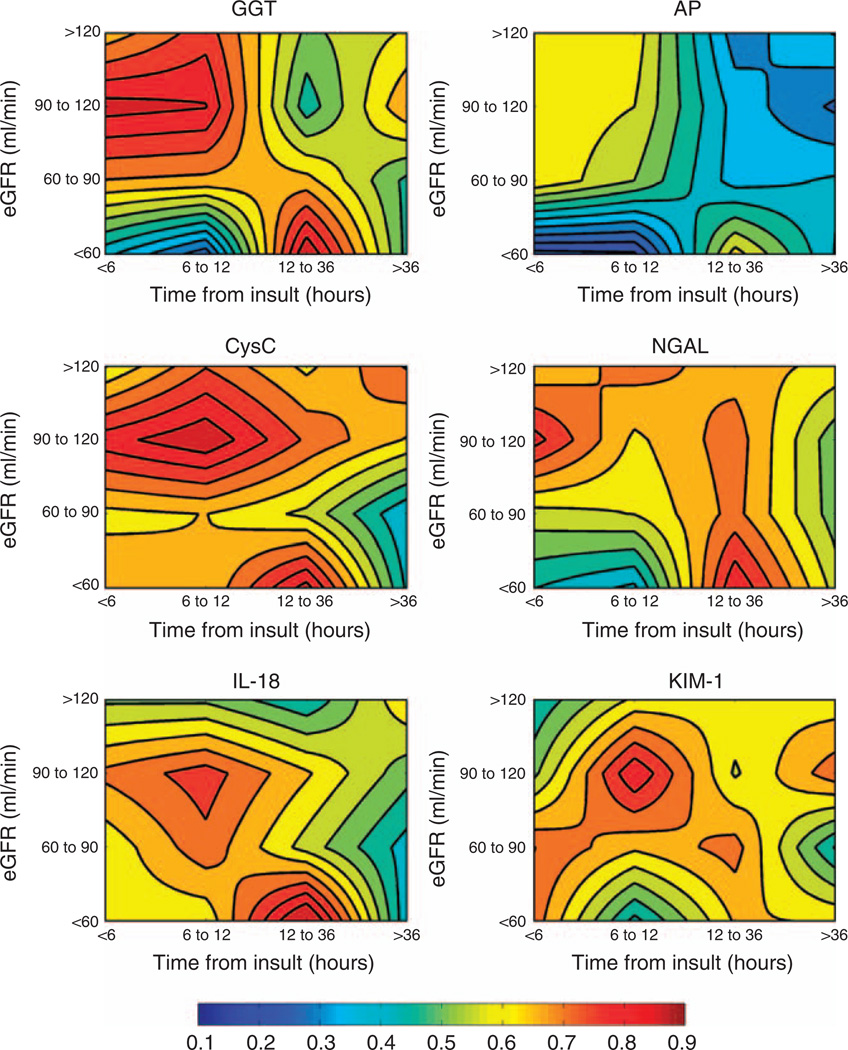
Figure 3. Schematic interpretation of biomarker diagnostic performance, stratified for both time after renal insult and for baseline (pre-entry) renal function.
Contour plots of the AUCs for each urinary biomarker indexed to urinary creatinine for diagnosis of AKI (AKIN) on entry to the ICU, illustrating that the diagnostic performance of a biomarker depends on both the individual’s normal renal status (eGFR) and the time of the measurement from insult. An AUC of 0.5 indicates no diagnostic capability. An AUC above 0.5 (red end of the color spectrum) indicates that high biomarker concentrations are diagnostic, and an AUC below 0.5 (blue end) illustrates that low biomarker concentrations are diagnostic. Contour lines are at AUC 0.05 intervals. Plots are based on the AUCs in Appendix Table 1. It must be noted that the contour lines are evenly spaced, interpolated lines between 16 points in each. These should not be interpreted as linear scales. AKI, acute kidney injury; AP, alkaline phosphatase; AUC, area under the receiver operator characteristic curve; CysC, cystatin C; eGFR, estimated glomerular filtration rate; GGT, γ-glutamyltranspeptidase; ICU, intensive care unit; IL-18, interleukin-18; KIM-1, kidney injury molecule-1; NGAL, neutrophil-gelatinase-associated lipocalin.

