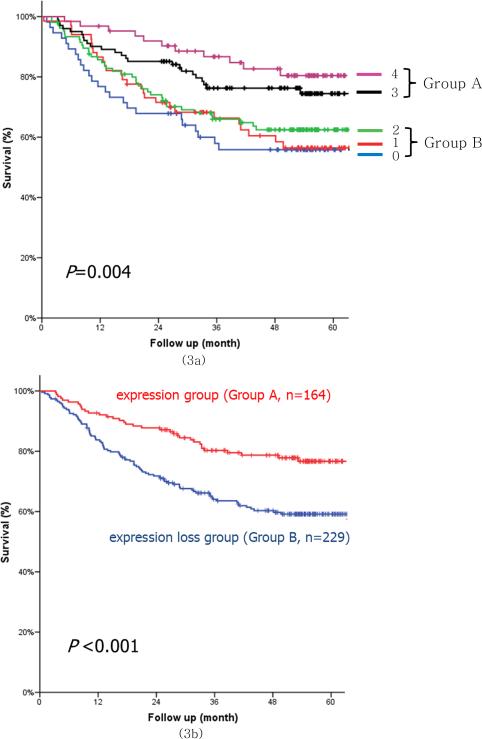
Figure 3.
Survival curves for the combined expression of membranous type MUC13, CDH17, LGALS4, REG4 (3a) and the combination of the positive expression (Group A) and expression loss (Group B) groups (3b). Group A indicates the positive expression group in which ≥ 3 proteins among membranous type MUC13, CDH17, LGALS4 and REG4 were expressed. Group B indicates the expression loss group in which ≤ 2 proteins among membranous type MUC13, CDH17, LGALS4 and REG4 were expressed.

