Figure.
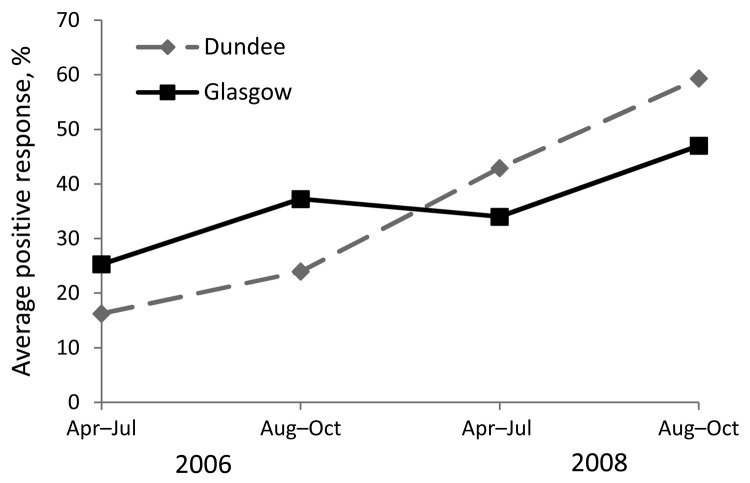
Mean percentage positive response (PPR) (IgG) to the 27-kDa antigen of Cryptosporidium oocysts among blood donors in Glasgow and Dundee, Scotland, 2006–2008. This graph represents the (model estimate) geometric mean PPR for an average participant followed up for the 4 time periods. The plot does not represent the proportion of participants for whom serologic response to the 27-kDa antigen was positive.

