
Figure 1.
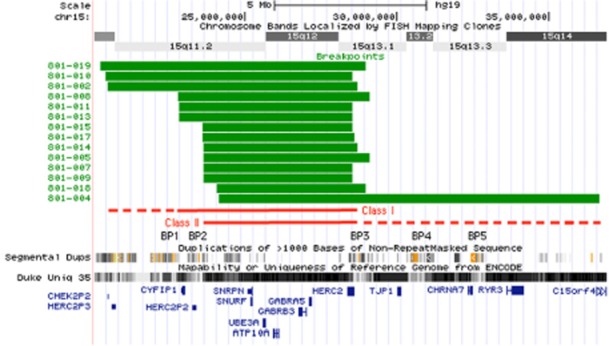
Size and breakpoints of interstitial duplication cases in this study. The boundaries of the duplications were determined using targeted or whole-genome array comparative genomic hybridization (aCGH) and the estimated base positions for the duplicated regions mapped to human genome assembly hg19 using the UCSC genome browser (green bars). Additional tracks included in this image are the ideogram track (showing cytogenetic bands), the segmental duplication track (showing the locations of segmental duplications >1000 bp) and the Duke Unique 35 track (showing the mapability of a given region of the genome). The locations of several significant RefSeq genes across the duplicated region are indicated in blue, but a comprehensive list of genes in this region is available at http://genome.ucsc.edu. The locations of canonical breakpoints for both interstitial and isodicentric duplications in this region are indicated as BP1–BP5. Note that these breakpoint locations coincide with the presence of an increased number of complex segmental duplications and a decrease in the mapability at this locus. Note the apparent gap in segmental duplications and mapability at the proximal end of the diagram. This is also the location of a gap in the hg19 alignment and is still unresolved. A more detailed view of both the proximal and distal breakpoints for these cases is available in Figure S1.