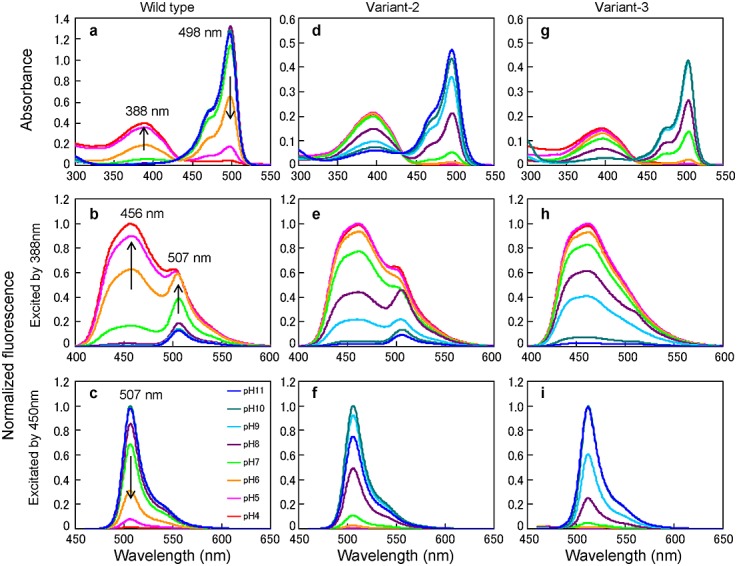
Figure 4.

Absorption spectra (a,d,g) and normalized fluorescence spectra during 388 nm excitation (b,e,h) and 450 nm excitation (c,f,i) at pH 4 to 11 (mean of three replicates) in wild-type CoGFP (a,b,c), variant-2 CoGFP (d,e,f), and variant-3 CoGFP (g,h,i). Arrows show the effect of decreasing pH.
