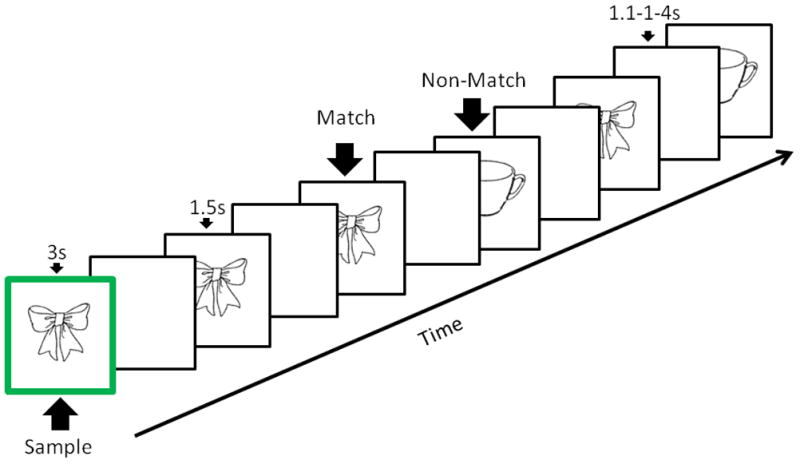
Figure 1.

The schematic represents a typical empirical trial. The z-axis represents time. First, a sample image with a green border was shown to the participant. After a jittered delay, the participant indicated whether each of a series of images matched or did not match the sample. Individual images were tested 2–3 times per trial. A new sample image was used in the each trial.
