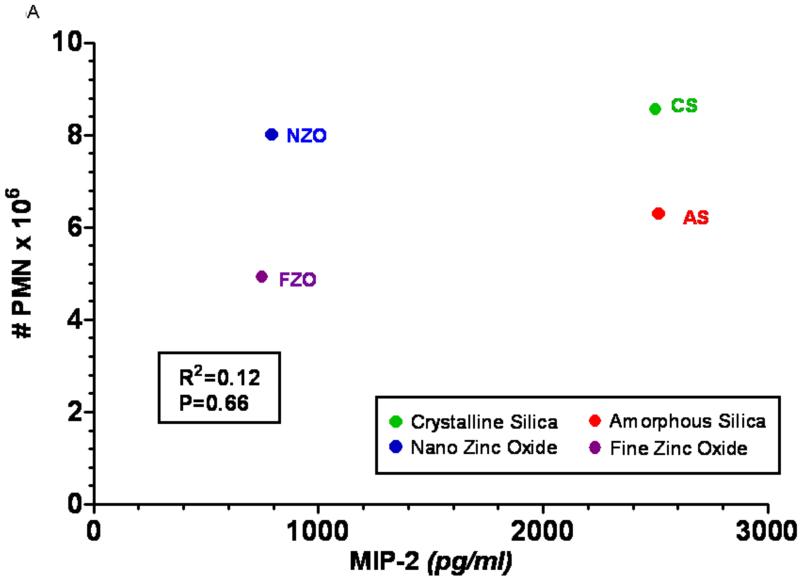
FIGURE 5.
Re-analysis of in vivo/in vitro correlations of responses of different particles based on dose-relationships observed at 24 hrs following in vitro dosing of lung cells and in vitro intratracheal instillations of rats, reported by Sayes et al. (2007). For the re-analysis of the data, the in vivo and in vitro responses were either compared based on their highest values as directly determined in the assays (Figs. 5A, C) or they were based on the highest response per unit particle surface area (concept of biological response-metric) calculated from the steepest part of the in vitro and in vivo dose-response relationships (Figs. 5B, D). Associated Spearman correlations and p-values for significance of linear fit show that expressing in vitro data as surface area based response-metrics (derived from steepest slope of dose-response data) has a good predictive power for in vivo responses. A: In vivo (number of PMNs in rat lung lavage) vs. in vitro (rat alveolar macrophage induction of MIP-2) correlation, using the highest measured response elicited with high doses of the different particles.
B: In vivo (number of PMNs/cm2 in rat lung lavage) vs. in vitro (rat alveolar macrophage induction of MIP-2/cm2) correlation, using the highest response per unit particle surface area. (Note: crystalline silica and amorphous silica are clearly separated in 5B, but not in 5A).
C: In vivo (number of PMNs in rat lung lavage) vs. in vitro (release of LDH in rat alveolar macrophage + rat type 2 cell-line co-culture) correlation, using the highest measured response elicited with high doses of the different particles.
D: In vivo (number of PMNs/cm2 in rat lung lavage) vs. in vitro (release of LDH/cm2 in rat alveolar macrophage + rat type 2 cell-line co-culture) correlation, using the highest response per unit particle surface area.


